Figure 3.

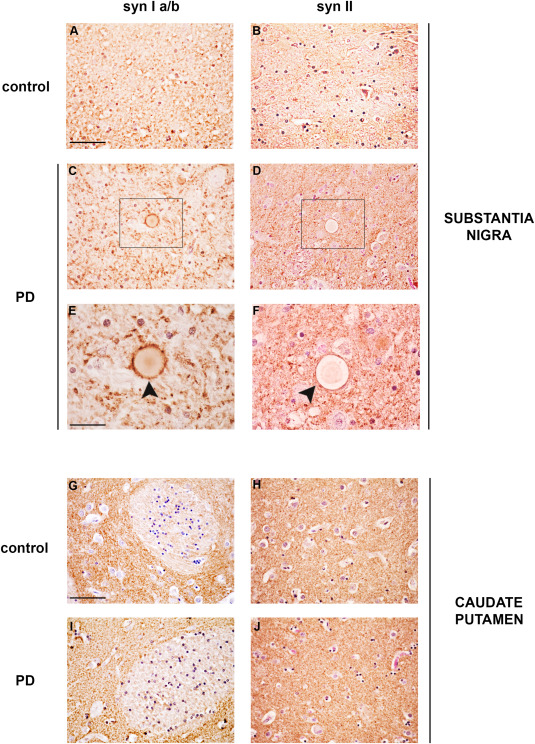
Synapsin Ia/b and syn II immunolabeling in the CP and SN of PD patients and age‐matched controls. Representative images showing syn Ia/b (A,C,E,G,I) and syn II (B,D,F,H,J) immunolabeling in the SN (A–F) and CP (G–J) of PD patients and age‐matched control subjects (CTR). Please note that LB in the SN of PD subjects did neither show positivity for syn Ia/b (C,E, black arrowhead) nor for syn II (D,F, black arrowhead). Scale bars: (A–D, G–J) 50 µm, (E,F) 20 µm.
