
Figure 1.
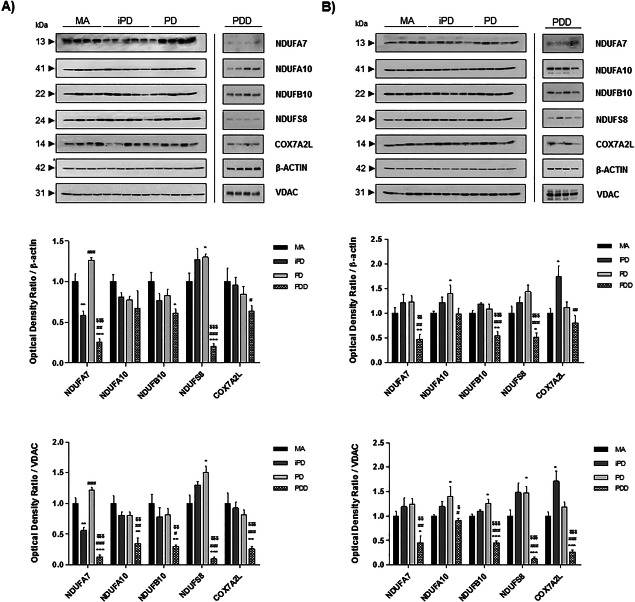
Representative western blots of NDUFA7, NDUFA10, NDUFB10, NDUFS8 and COX7A2L protein expression in frontal cortex area 8 (A) and the angular gyrus (B) in MA, iPD, PD and PDD. Expression values are normalized with β‐actin and VDAC. Graphs represent the total number of cases examined (see Table 1). Data are represented as mean ± SEM. Student's T‐test: *P < 0.05, **P < 0.01, ***P < 0.001, significant differences in iPD, PD or PDD when compared with MA cases. # P < 0.05, ## P < 0.01, ### P < 0.001, differences between PD or PDD vs. iPD cases. $ P < 0.05, $$ P < 0.01, $$$ P < 0.001, observed differences when comparing PD to PDD individuals. aNo Gaussian distribution (Mann–Whitney test).