
Figure 5.
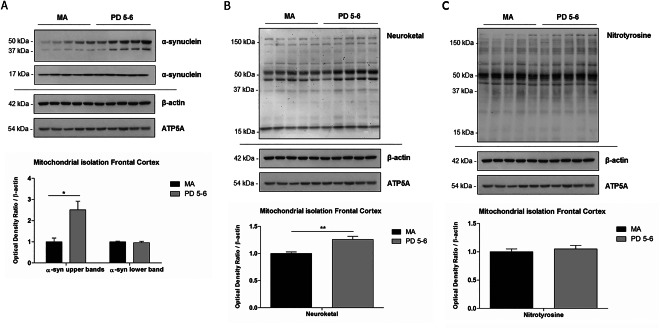
Western blot of mitochondrial‐enriched fractions in frontal cortex (FC) in MA cases and PD. (A) No differences in protein expression levels of monomeric α‐synuclein 17 kDa are seen between MA and PD. However, significant expression of oligomeric α‐synuclein of 37 and 50 kDa is found in PD when compared with MA. β‐actin is used as a marker of protein loading, and ATP5A as a mitochondrial marker. (B) Increased levels of neuroketal (NKT) protein adducts in mitochondrial‐enriched fractions in PD when compared with MA cases. (C) No significant differences of N‐Tyrosine levels are seen between the two groups. Student's T‐test *P < 0.05, **P < 0.01.