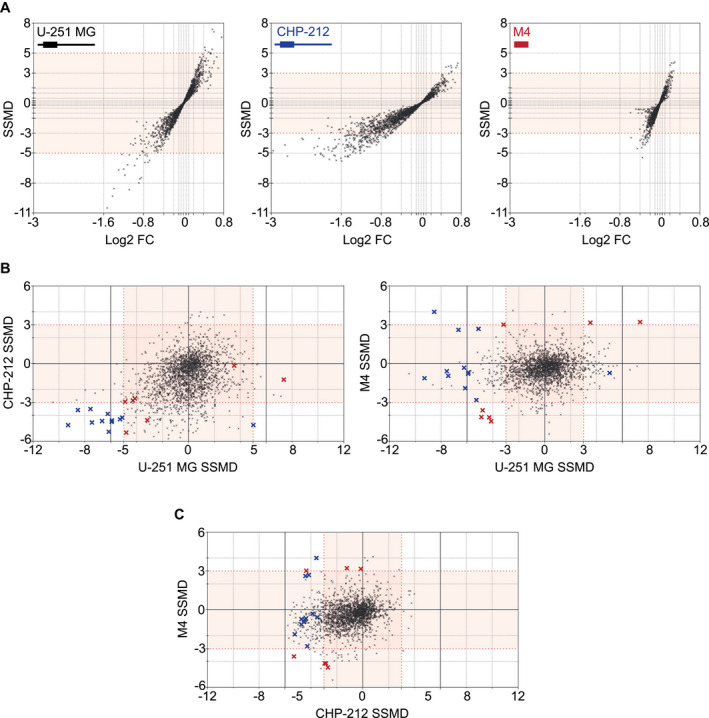
Figure 2.

miRNA mimic screening identified 19 candidate hits. A. Dual‐flashlight plots displaying SSMD vs. Log2 fold change (FC) with illustrations of each respectively expressed PRNP/Prnp transcript for U‐251 MG (black), CHP‐212 (blue) and SH‐SY5Y M4 (red) screens. Sample distribution angles illustrated in plots indicate cell‐line dependent variability in PrPC expression, with U‐251 MG exhibiting stronger sample replicability, exemplified by high SSMDs, and CHP‐212 exhibiting larger biological effect sizes, as illustrated by greater Log2 fold changes. B. SSMD overlaps between U‐251 MG (SSMD ≥5, ≤−5) and CHP‐212 (≥3, ≤−3) (left plot) identified 12 candidates (blue crosses). SSMD overlaps between U‐251 MG (≥3, ≤−3) and M4 (≥3, ≤−3) (right plot) identified 7 candidates (red crosses). A majority of candidates displayed consistent miRNA‐induced down‐ or upregulation in overlapped screens, whereas three hits exhibited divergent PrPC regulation. (Bottom right quadrant of left plot: 1 blue cross. Top left quadrant of right plot: 1 blue and 1 red cross). C. SSMD overlaps between CHP‐212 (≥3, ≤−3) and SH‐SY5Y M4 (≥3, ≤−3) shows comparative distribution of mimic candidates.
