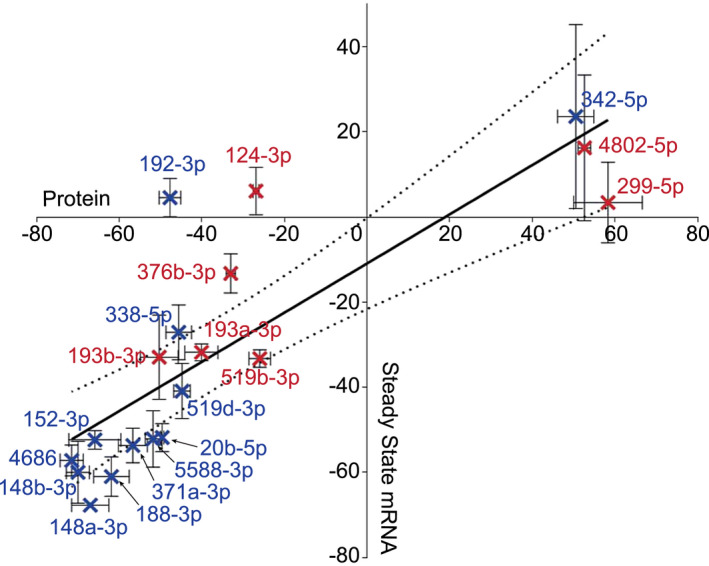
Figure 3.

Relationship between expression of PRNP mRNA and PrPC protein in cells treated with miRNA mimics. Correlation coefficient of the linear regression analysis between PrPC protein (N = 3, Standard error of the mean (SEM) error bars) and steady state PRNP mRNA (N = 3, Standard error of the mean (SEM) error bars) was R 2: 0.679 with 95% confidence intervals. This suggests that miRNA mimic‐driven regulation of PrPC results from degradation of the PRNP transcript. Blue crosses represent CHP‐212, while red crosses represent SH‐SY5Y M4 screen overlaps. Axis values indicate changes in expression relative to respective controls.
