
Figure 1.
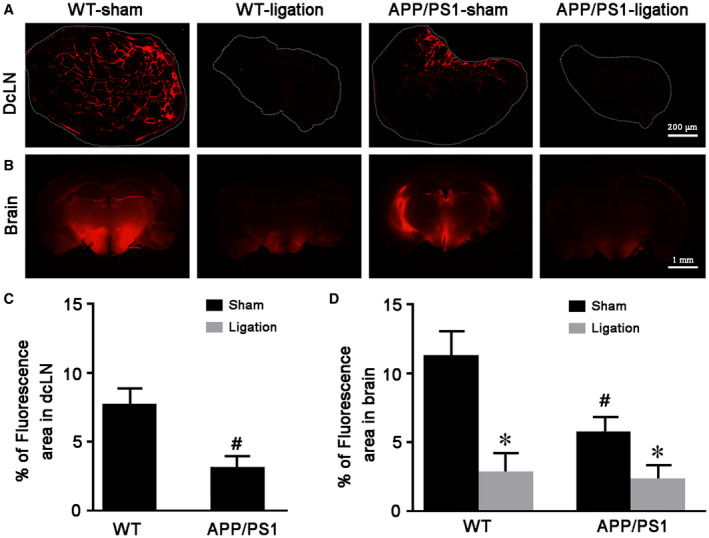
Ligation of dcLNs blocks peripheral drainage of intracisternally injected TR‐d3 and decreased its influx into the rain parenchyma. A, B. Representative images showing TR‐d3 fluorescence within dcLNs and forebrain 30 minutes after injection into cisterna magna. C, D. The percentage of TR‐d3 fluorescent area of dcLNs and forebrain, respectively. Data represent mean ± SEM from four mice per group. Data in Figure 1C were analyzed by paired‐student t test, #P < 0.05, WT vs. APP/PS1. Data in Figure 1D were analyzed by the two‐way ANOVA with Tukey’s post hoc test. Ligation: F1,12 = 15.792, P = 0.002; Genotype: F1,12 = 5.396, P = 0.039; Interaction: F1,12 = 3.052, P = 0.106; #P < 0.05, WT vs. APP/PS1; *P < 0.05, sham vs. dcLNs.