
Figure 4.
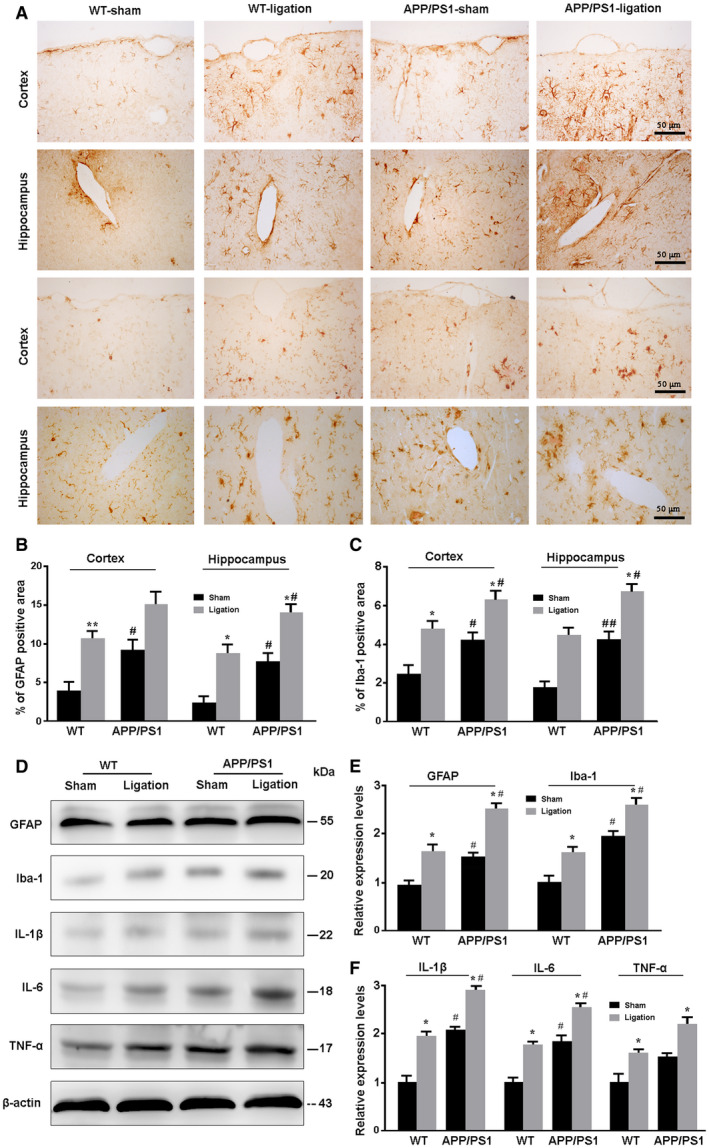
Analysis of reactive gliosis and neuroinflammatory response in the brain. A. Representative images showing expression and distribution of GFAP‐positive astrocytes and Iba‐1 positive microglia in the cortex and hippocampus of mice. B, C. The percentage of GFAP (B) and Iba‐1 (C) positive area in the cortex and hippocampus, respectively. D. Representative Western blot bands for GFAP, Iba‐1, IL‐1β, IL‐6 and TNF‐α in the brain of mice. E, F. Densitometry analysis of the expression levels of GFAP and Iba‐1 (E), and IL‐1β, IL‐6 and TNF‐α (F). Data represent mean ± SEM from four mice per group and analyzed by the two‐way ANOVA with Tukey’s post hoc test. Figure 4B: Ligation: cortex, F1,12 = 14.871, P = 0.002; hippocampus, F1,12 = 23.441, P = 0.000; Genotype: cortex, F1,12 = 8.336, P = 0.014; hippocampus, F1,12 = 15.396, P = 0.002; Interaction: cortex, F1,12 = 0.028, P = 0.871; hippocampus, F1,12 = 0.073, P = 0.790. Figure 4C: Ligation: cortex, F1,12 = 23.369, P = 0.000; hippocampus, F1,12 = 21.708, P = 0.001; Genotype: cortex, F1,12 = 12.752, P = 0.004; hippocampus, F1,12 = 19.618, P = 0.001; Interaction: cortex, F1,12 = 0.003, P = 0.955; hippocampus, F1,12 = 0.208, P = 0.656. Figure 4E: GFAP: Ligation (F1,12 = 14.982, P = 0.002); Genotype: (F1,12 = 10.334, P = 0.007); Interaction: (F1,12 = 0.413, P = 0.533); Iba‐1: Ligation (F1,12 = 12.281, P = 0.004); Genotype: (F1,12 = 24.940, P = 0.000); Interaction: (F1,12 = 0.004, P = 0.952). Figure 4F: IL‐1β: Ligation (F1,12 = 16.947, P = 0.001); Genotype: (F1,12 = 21.495, P = 0.001); Interaction: (F1,12 = 0.096, P = 0.762); IL‐6: Ligation (F1,12 = 14.939, P = 0.002); Genotype: (F1,12 = 20.409, P = 0.001); Interaction: (F1,12 = 0.072, P = 0.793); TNF‐α: Ligation (F1,12 = 14.141, P = 0.003); Genotype: (F1,12 = 11.330, P = 0.006); Interaction: (F1,12 = 0.018, P = 0.897). *P < 0.05, sham vs. LdcLNs;#P < 0.05, ##P < 0.01, WT vs. APP/PS1.