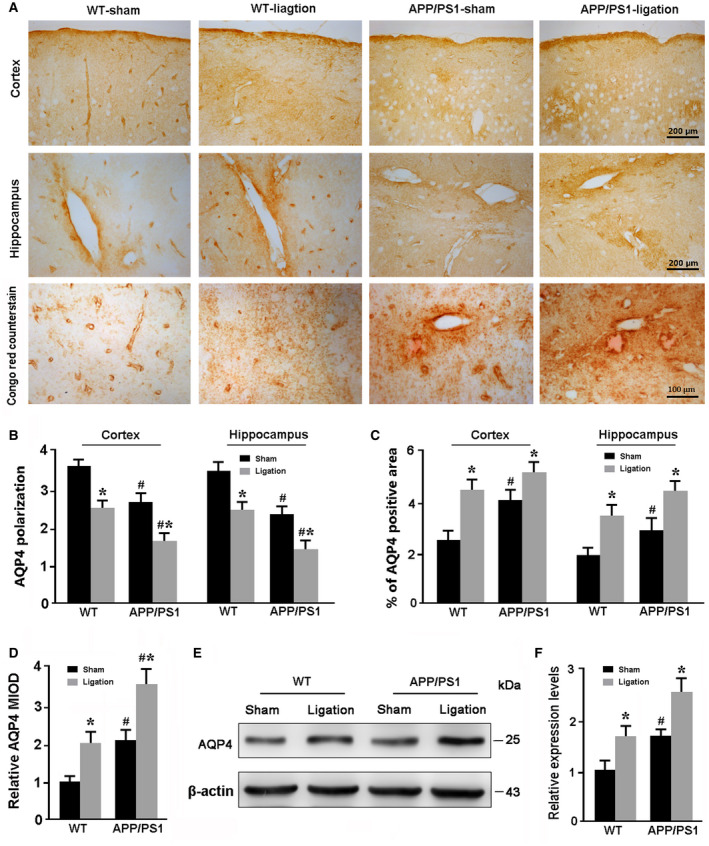
Figure 5.

Analysis of AQP4 polarity and expression in the brain. A. Representative immunohistochemical images showing expression and distribution of AQP4 in the cerebral cortex and hippocampus. Ligation of dcLNs resulted in abnormal localization of AQP4 at parenchymal domains, especially surrounding Congo red‐positive Aβ plaques. B. Quantitative analyses of AQP4 polarization in the cerebral cortex and hippocampus. C. The percentage of AQP4 positive area in the hippocampus and cerebral cortex. D. The relative mean integrated optical density (MIOD) of AQP4 immunoreactivty at the parenchymal domains. E, F. Representative Western blot bands and densitometry analysis of Aβ1‐40, Aβ1‐42, Tau and PHF‐1 from the forebrain samples. Data represent mean ± SEM from four mice per group. The two‐way ANOVA with Tukey’s post hoc test. Figure 5B: Ligation: cortex: F1,12 = 21.317, P = 0.001; hippocampus: F1,12 = 17.706, P = 0.001; Genotype: cortex: F1,12 = 14.232, P = 0.003; hippocampus: F1,12 = 21.007, P = 0.001; Interaction: cortex: F1,12 = 0.007, P = 0.933; hippocampus: F1,12 = 0.019, P = 0.892. Figure 5C: Ligation: cortex: F1,12 = 13.991, P = 0.003; hippocampus: F1,12 = 18.548, P = 0.001; Genotype: cortex: F1,12 = 5.060, P = 0.044; hippocampus: F1,12 = 6.149, P = 0.029; Interaction: cortex: F1,12 = 1.324, P = 0.272; hippocampus: F1,12 = 0.018, P = 0.894. Figure 5D: Ligation: F1,12 = 9.198, P = 0.004; Genotype: F1,12 = 12.362, P = 0.001; Interaction: F1,12 = 0.044, P = 0.835. Figure 5F: Ligation: F1,12 = 12.913, P = 0.004; Genotype: F1,12 = 16.026, P = 0.002; Interaction: F1,12 = 0.004, P = 0.948. #P < 0.05, WT vs. APP/PS1; *P < 0.05, sham vs. LdcLNs.
