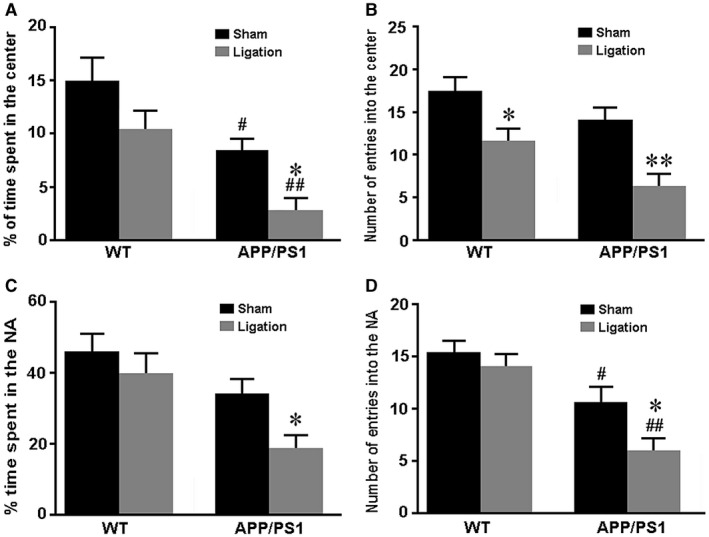
Figure 8.

Analysis of exploratory behavior and short‐term working memory. A–C. The open field test. (A) Tracing of mouse movement during the 5‐minutes test period. (B) The percentage of time spent in the center area after tracing of mouse movement during the 10‐minutes test period. (C) The number of entries into the center area. D, E. The Y‐maze test. The percentage of time spent in the novel arm (D). The number of entries into the novel arm (E). Data represent mean ± SEM from 16 mice per group. The two‐way ANOVA with Tukey’s post hoc test. Figure 8A: Ligation, F1,60 = 5.388, P = 0.024; Genotype, F1,60 = 12.068, P = 0.001; Interaction , F1,60 = 0.029, P = 0.865; Figure 8B: Ligation, F1,60 = 5.918, P = 0.018; Genotype, F1,60 = 13.504, P = 0.001; Interaction, F1,60 = 0.112, P = 0.739; Figure 8C: Ligation, F1,60 = 4.534, P = 0.037; Genotype, F1,60 = 7.035, P = 0.010; Interaction, F1,60 = 0.511, P = 0.477; Figure 8D: Ligation, F1,60 = 5.673, P = 0.020; Genotype, F1,60 = 12.313, P = 0.001; Interaction, F1,60 = 0.096, P = 0.758. #P < 0.05; ##P < 0.01, WT vs. APP/PS1; *P < 0.05, sham vs. LdcLNs.
