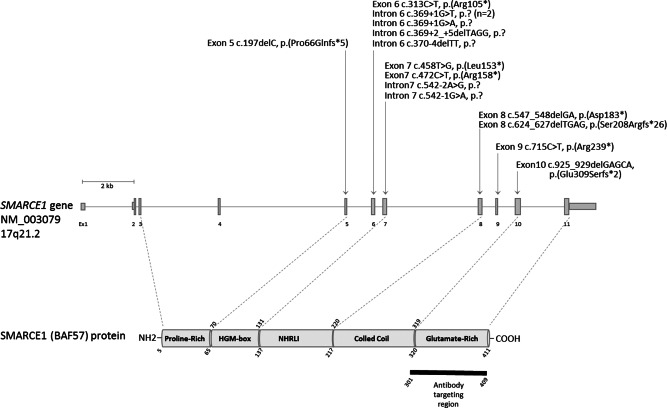
Figure 3.

Schematic representation of the SMARCE1 gene and the corresponding encoded protein. Exons are depicted as vertical bars and numbered from exon 1 to exon 11. The position of the SMARCE1 variants identified in this study are indicated above the gene.
