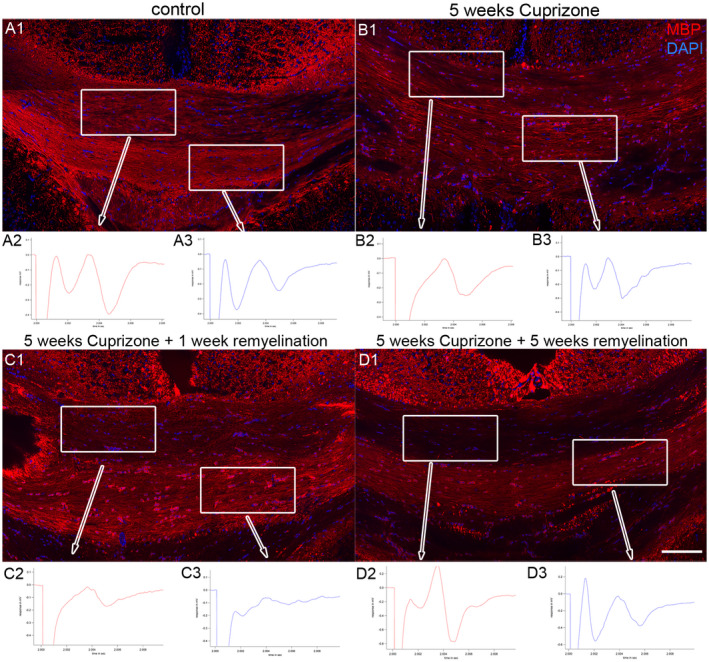
Figure 3.

Effects of cuprizone‐feeding on myelin function. Staining for myelin basic protein MBP (red) is shown in control conditions (A1), after 5 weeks of cuprizone treatment (B1), at 5 weeks of cuprizone feeding and 1 week of remyelination (C1) and after 5 weeks of cuprizone and 5 weeks of remyelination (D1). DAPI staining is shown in blue. Scale bar represents 100 μm. Corresponding compound action potentials (CAPs) are depicted below each time point. Control: A2. CAP in upper “light” bundles, A3. CAP in lower “dark” bundles. 5 weeks cuprizone: B2. CAP in upper “light” bundles, B3. CAP in lower “dark” bundles. 5 weeks of cuprizone plus 1 week of remylination: C2. CAP in upper “light” bundles, C3. CAP in lower “dark” bundles. 5 weeks of cuprizone plus 5 weeks of remyelination: D2. CAP in upper “light” bundles, D3. CAP in lower “dark” bundles.
