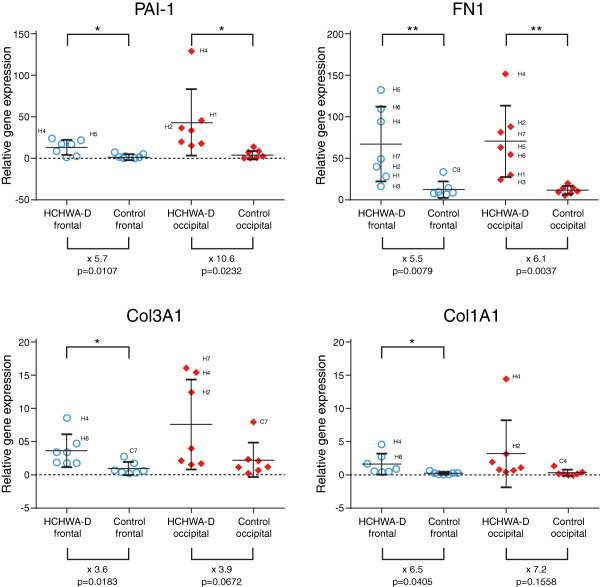
Figure 2.

Significant upregulation of PAI‐1 and FN1 gene levels (upper panel; x indicates the time fold change) in HCHWA‐D frontal (Frt) and occipital (Occ) cortex compared to age‐related controls. Col3A1 and Col1A1 increase reach statistical significance in frontal cortex only. Transcript expression levels in postmortem brain cortex were normalized with two reference genes and represented in a dot plot with mean ± SD of seven samples; *P < 0.05, **P < 0.01, ***P < 0.001 and ****P < 0.0001 as determined by a two‐tailed unpaired Student's t test.
