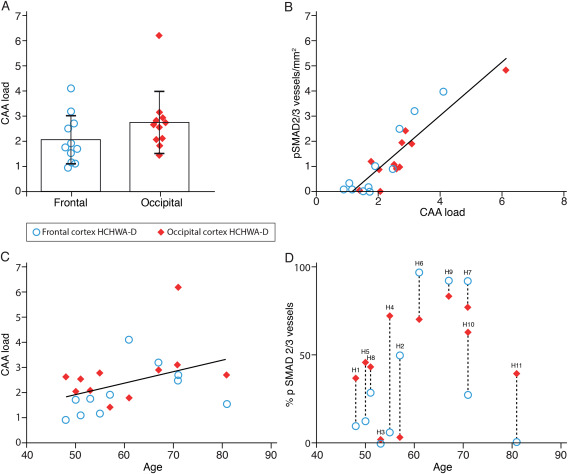
Figure 4.

Quantification of CAA load and relationship with pSMAD2/3 accumulation in HCHWA‐D. A. CAA load was higher in occipital cortex but did not reach statistical difference (two‐tailed paired Student's t test; the graph represents the mean ± SD of angiopathic vessels per mm2). B. Angiopathic pSMAD2/3 vessel wall deposits were correlated positively with CAA load (both expressed as number of vessel per mm2; r 2 = 0.8220, P < 0.0001). C. CAA load was weakly correlated with age (r 2 = 0.1702; not statistically significant). D. Proportion of angiopathic vessels in HCHWA‐D subjects with pSMAD2/3 vessel wall deposits (dashed lines link brain parts of the same subject; H numbers refer to Table 1).
