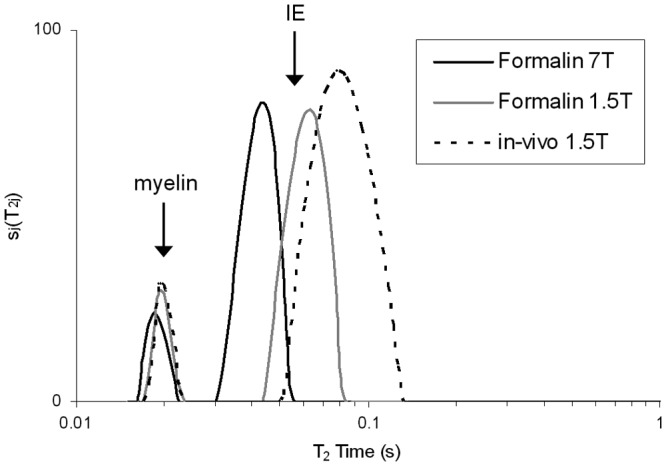
Figure 2.

T2 distribution from multiple sclerosis (MS) normal‐appearing white matter (NAWM) in formalin at 7T (black), 1.5T (gray) and in vivo (light gray). All three distributions have a similar shape, showing two distinct peaks with the myelin water peak on the left and intra/extracellular (IE) component on the right. However, the IE component is shifted to shorter times for the 1.5T formalin sample, and even shorter for the 7T formalin sample when compared to in vivo. (Reprinted from NeuroImage. 2008;40( 4 ): Laule C, Kozlowski P, Leung E, Li DKB, Mackay AL, Moore GRW. Myelin water imaging of multiple sclerosis at 7 T: Correlations with histopathology. pages 1575–1580, Figure 1 , Copyright 2008, with permission from Elsevier).
