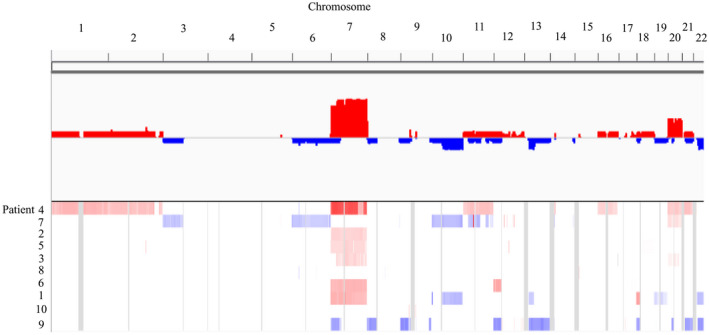
Figure 5.

Arm‐level copy number variations in gcGBM. Chromosome gains (shown in red) and losses (shown in blue) were identified by WES. The numbers on top of the plot represent chromosome number (1–22), and the numbers on the left indicate patient number.
