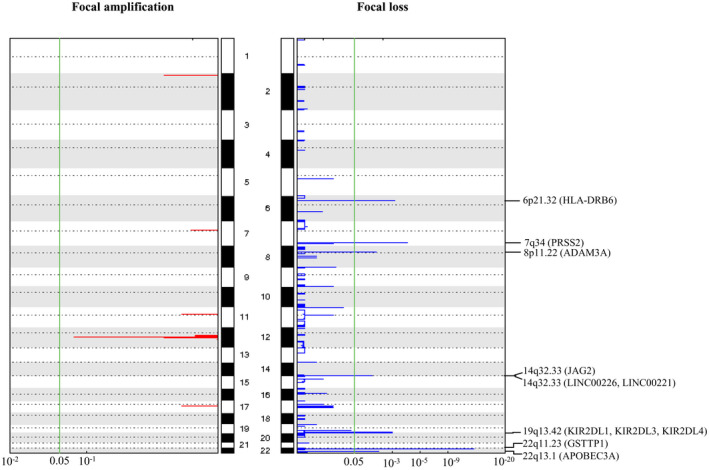
Figure 6.

Significant focal copy number variations in gcGBM as revealed by GISTIC 2.0. The plot illustrates the statistical significance of aberrations displayed as FDR Q‐values (x‐axes). The human chromosomes 1 to 22 (hg19) are indicated along the y axis. Eight focal regions surpass the significance threshold (green line). Chromosomal locations of GSTT1, PRSS2, HLA‐DRB6, KIR2DL1, KIR2DL3, KIR2DL4, APOBEC3A, ADAM3A, JAG2, LINC00226 and LINC00221 Q‐value are indicated on the plot.
