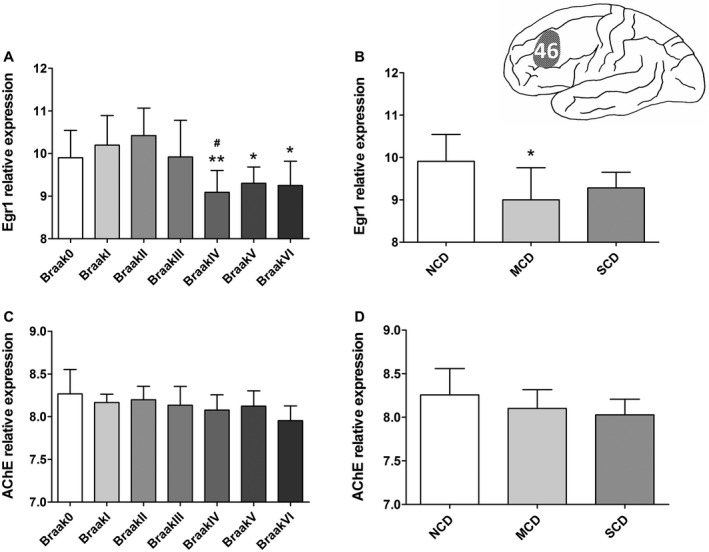
Figure 1.

Expression of mRNA of early growth response 1 (EGR1) and acetylcholinesterase (AChE) in the prefrontal cortex (Brodmann area 46) during the course of Alzheimer’s disease (AD). A. EGR1‐mRNA levels showed significant changes (ANOVA, F(6,42) = 4.651, P = 0.001) among Braak stages. EGR1‐mRNA is especially decreased in Braak IV compared with Braak I and II, and further decreased in Braak V–VI (Bonferroni test, P ≤ 0.043); B. EGR1‐mRNA levels also showed a significant change among Reisberg groups (ANOVA, F(2,22) = 4.189, P = 0.0287), and in particular they significantly declined in the mild cognitive decline (MCD) group compared with the no cognitive decline (NCD) group (Bonferroni test, P = 0.033). C. AChE‐mRNA did not show a significant decrease along the Braak stages (ANOVA, F(6,42) = 1.877, P = 0.107). D. AChE‐mRNA also did not show significant changes among Reisberg groups (ANOVA, F(2,22) = 2.176, P = 0.137). The normalized data (log2‐transformation) are represented as mean (± standard deviation). (*) compared with (A) Braak II and (B) NCD, (#) compared with Braak I. *P < 0.05, **P < 0.01, # P < 0.05.
