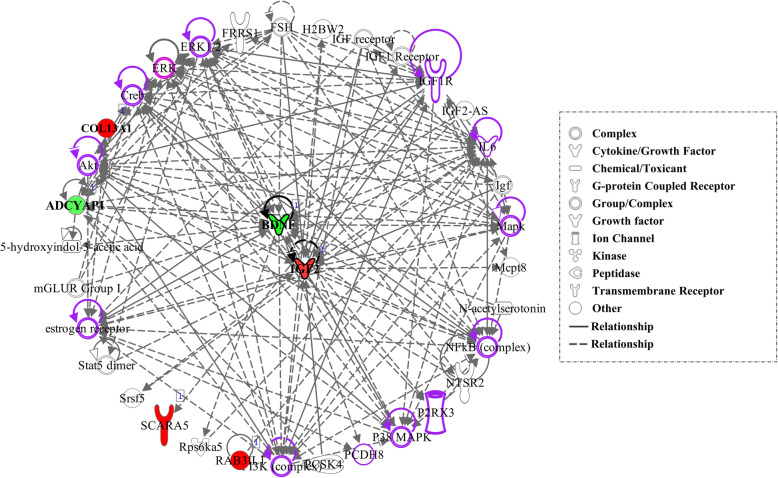
Fig. 2.
Top-scoring regulatory network identified with the IPA software, highlighting behavior related functions. Up and down-regulated differentially expressed genes (DEG) in the aggressive Lidia breed are displayed with red (up-regulated) and green (down-regulated) nodes, respectively. Genes are represented as nodes, and the molecular relationships between nodes are represented either as straight lines for direct interactions, or dotted lines for indirect interactions. The molecules highlighted in purple are those associated with the behavioral features detailed in Table 5

