
Figure 3.
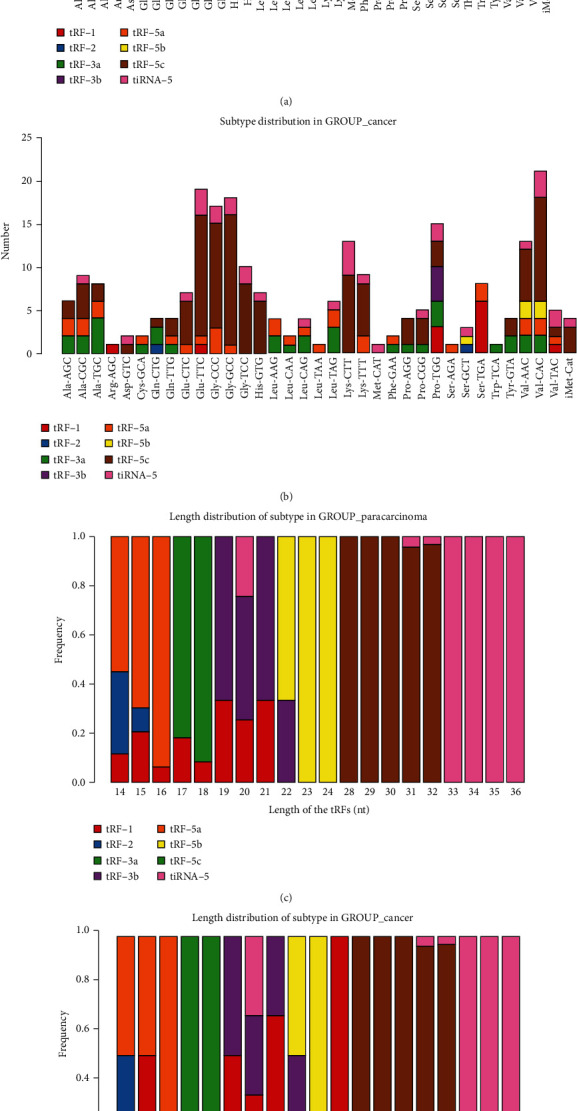
Stacked bar chart. (a) The stacked plot showed the number of tRF and tiRNA subtypes derived from the same anticodon tRNA in normal samples. (b) The stacked plot showed the number of tRF and tiRNA subtypes derived from the same anticodon tRNA in HGSOC. (c) The frequency of subtypes against the length of the tRFs and tiRNAs in normal samples. (d) The frequency of subtypes against the length of the tRFs and tiRNAs in HGSOC.