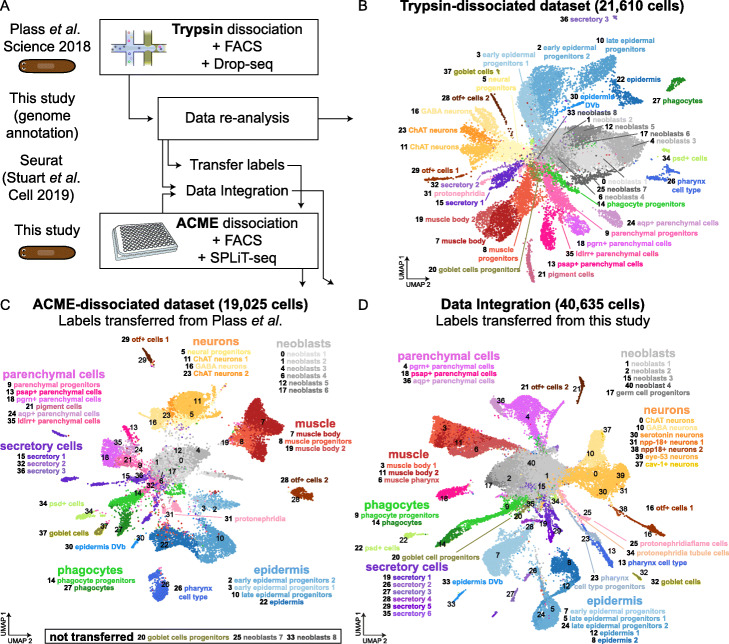
Fig. 8.
Integrative analysis of planarian trypsin- and ACME-dissociated datasets. a Analysis workflow. b UMAP visualization of 21,610 trypsin-dissociated S. mediterranea cells reanalyzed from Plass et al., colored by cluster identity and annotated on the basis of marker genes. c UMAP visualization of 19,025 ACME-dissociated S. mediterranea cells colored by transfer label analysis from trypsin-dissociated cell analysis (a). The numbers in the plot denote the center of the cells transferred with each of the trypsin-dissociated cell clusters. d UMAP visualization of 40,635 cells integrating trypsin-dissociated and ACME-dissociated cells. Clusters are colored by transfer label analysis from ACME-dissociated cell analysis

