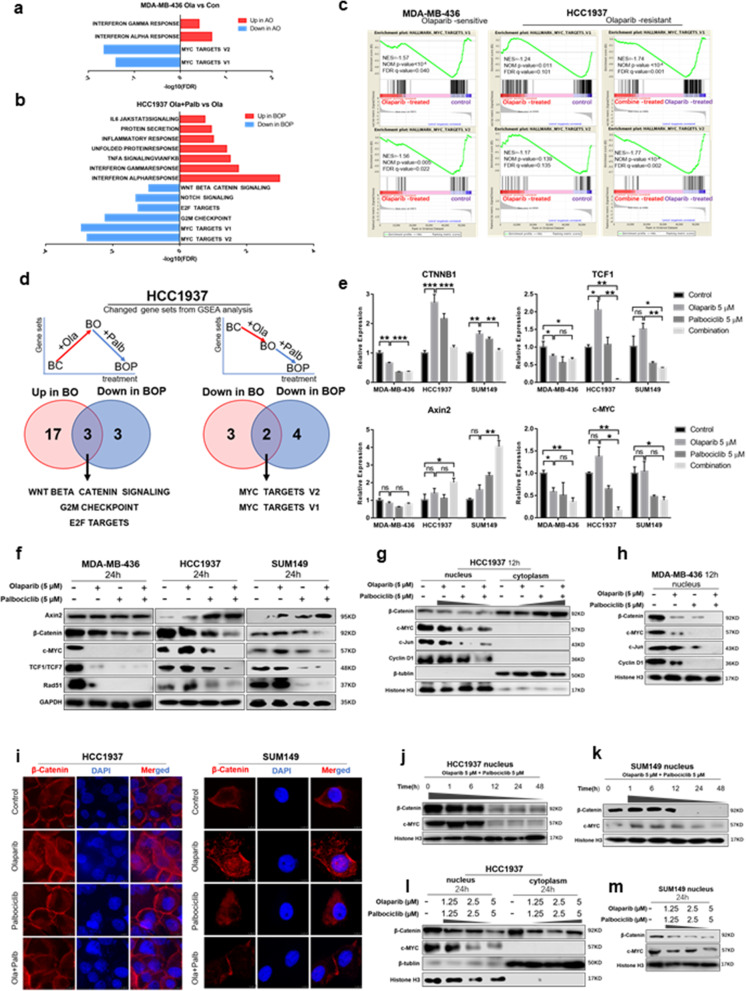
Fig. 3.
The combined use of olaparib and palbociclib inhibits MYC expression through the Wnt pathway. a GSEA results in olaparib-treated PARPi-sensitive MDA-MB-436 cells (AO) compared to vehicle-treated cells (AC). b GSEA results in combination-treated olaparib-resistant HCC1937 cells (BOP) compared to olaparib-treated cells (BO). c GSEA of MYC gene signatures in MDA-MB-436 (left panels) and HCC1937 (right panels) cells with different treatments. d (Left) The overlap of hallmark gene sets in GSEA, which were downregulated in combination-treated cells (BOP) but upregulated in olaparib-treated resistant HCC1937 cells (BO). (Right) The overlap of hallmark gene sets in GSEA that were downregulated in both BO and BOP. e Quantitative reverse transcription PCR analysis of CTNNB1, TCF1, Axin2 and MYC in MDA-MB-436, HCC1937 and SUM149 BRCAmut/TNBC cell lines treated with drugs as indicated for 24 h. Mean ± S.D. for three independent experiments. f WB analysis showed the total levels of β-catenin, TCF1, Axin2, c-myc and Rad51 in three BRCAmut/TNBC cell lines treated with drugs as indicated for 24 h. g WB analysis showed the nucleoplasmic distribution of β-catenin and the change in the Wnt pathway (c-myc, c-Jun and Rad51) in HCC1937 upon treatment with drugs as indicated for 12 h. h WB analysis showed the change in the Wnt pathway (c-myc, c-Jun and Rad51) in MDA-MB-436 upon treatment with drugs as indicated for 12 h. i Immunofluorescence analysis of the nucleoplasmic distribution of β-catenin in olaparib-resistant HCC1937 and SUM149 cells treated with drugs as indicated for 12 h. Scale bar, 7.5 μm. j Changes in nuclear β-catenin and c-myc protein levels in HCC1937 over time under the indicated treatment. k Changes in nuclear β-catenin and c-myc protein levels in SUM149 over time under the indicated treatment. l Changes in the nucleoplasmic distribution of β-catenin and c-myc in HCC1937 under different drug concentrations for 24 h. m Changes in the nuclear distribution of β-catenin and c-myc in SUM149 under different drug concentrations for 24 h. Student’s t-test; ***p < 0.001, **p < 0.01, *p < 0.05; ns, not significant. The data are presented as the means ± SEMs. Con: Control; Ola: Olaparib; Palb: Palbociclib

