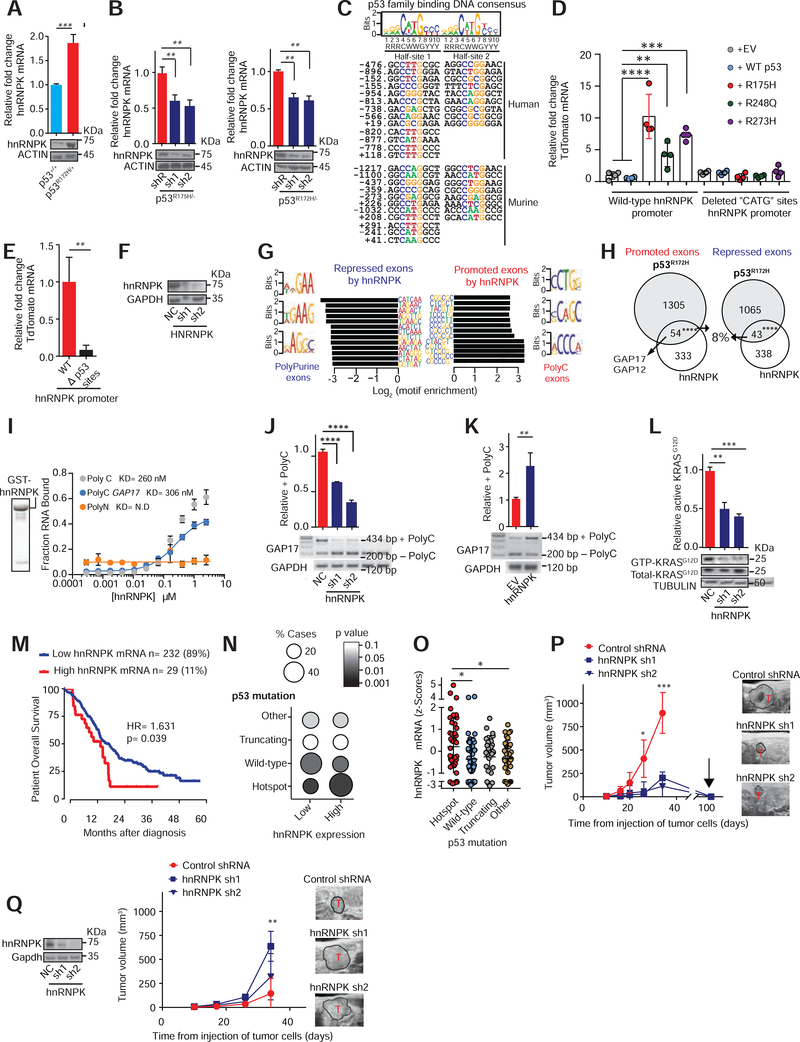
Figure 3: Mutant p53 regulates hnRNPK to promote inclusion of +polyC GAP17.
A. Expression of hnRNPK in PanIN organoids (KrasG12D/+; Mist1-Cre) bearing p53R172H/+ compared to WT p53. qRT-PCR and western performed 20 days after genome editing confirmation. n = 3 replicates/condition. Mean ± s.d, Student’s t-test.
B. Expression of hnRNPK after knockdown of p53R175H in PDAC patient organoids (left, KRASG12D/+; TP53R175H/−) and KPC cells following transduction with doxycycline-inducible control (shR) or anti-p53 shRNAs (sh1 and 2) (right). qRT-PCR and western performed after 5 days of doxycycline. n = 3 replicates/condition. Mean ± s.d, Student’s t-test.
C. Top, nucleotide sequence logo of full and half-site p53 binding sites (Wei et al., 2006). Bottom, predicted p53-DNA binding sites in mouse and human hnRNPK promoters.
D. TdTomato reporter expression in WT hnRNPK promoter (−1429 to +260) and with “CATG”-deleted from p53 binding sites in p53 null PDAC cells (KPFLC cells), engineered to express human p53 mutants, WT p53, or empty vector (EV) control. n = 3 replicates/condition. Mean ± s.d, Student’s t-test.
E. TdTomato expression driven by the hnRNPK promoter using WT and “CATG”-deleted promoter sites in isogenic KPC cells. n = 3 replicates/condition. Mean ± s.d, Student’s t-test.
F. hnRNPK western in KPC cells following transduction with control non-targeting shRNA (NC) or anti-hnRNPK shRNAs (sh1 and 2).
G. Sequences enriched in repressed and promoted exons from RNA-Seq of KPC cells with knockdown of hnRNPK or negative control.
H. Intersection of differentially spliced exons by p53R172H and hnRNPK in KPC cells. Promoted (Fisher’s exact test p= 9.48E-06) and repressed (Fisher’s exact test p= 0.000149) exons shown.
I. Recombinant GST-hnRNPK protein (left). In vitro filter binding assays confirms interaction between recombinant hnRNPK and GAP17 +polyC exon. Known interactor of hnRNPK (polyC sequence) shown as positive control (C16-grey). Negative control in yellow (polyN sequence N16). Mean ± s.d, n = 3 replicates/condition. Student’s t-test.
J. RT-PCR and qRT-PCRs of GAP17 splicing in KPC cells with knockdown of hnRNPK compared to cells expressing control shRNAs (NC). RT-PCR using primers that flank the junctions of polyC exon (exon 17). Upper band: inclusion of exon 17; lower band: isoform lacking exon 17. qRT-PCRs for quantification of +polyC GAP17 retention using primers that flank junctions between exon 17 and adjacent exons. Mean ± s.d, n = 3 replicates/condition. Student’s t-test.
K. RT-PCR and qRT-PCRs of GAP17 splicing in KPFLC cells with overexpression of hnRNPK compared to cells expressing EV. RT-PCRs and qRT-PCRs as described in J. Mean ± s.d, n = 3 replicates/condition. Student’s t-test.
L. Affinity precipitation of GTP-bound KRASG12D in KPC cells following transduction with control shRNA (NC) or anti-hnRNPK shRNAs (sh1 and 2). Precipitation using GST-Raf1-RBD fusion protein, blotting using RasG12D antibody. Mean ± s.d, n = 3 replicates/condition. Student’s t-test.
M. Kaplan-Meier survival (log-rank Mantel-Cox test) of patients with PDACs expressing high- or low-hnRNPK mRNA (defined by the Akaike Information Criterion (Kletting and Glatting, 2009)). RNA-Seq from TCGA (n= 179) and ICGC (Bailey et al., 2016) (n= 88).
N. Statistical enrichment of p53 mutations (y axis) across PDACs expressing low (n=232) or high (n= 29) hnRNPK (y axis). Student’s t-test.
O. hnRNPK expression in ICGC PDACs (n= 88) with p53 hotspot mutations, WT p53, nonsense or frameshift mutations (“truncating mutations”), and other mutations. Student’s t-test.
P. T umor volume by 3D-ultrasound of mutant p53 KPC cells expressing control or anti-hnRNPK sh1 and 2. Arrow, tumor regression time point. Representative ultrasound images of tumors (T). Mean ± s.d, n = 5–6 animals/condition, Student’s t-test.
Q. Tumor volume by 3D-ultrasound of p53 null KPFLC cells expressing control or anti-hnRNPK. Representative ultrasound images of PDAC tumors (T). Mean ± s.d, n = 5–6 animals/condition, Student’s t-test.
s.d, standard deviation; n, number of repetitions. *p < 0.05, **p < 0.01, ***p < 0.001, ****p < 0.0001. See also Figure S4 and Tables S4–5.

