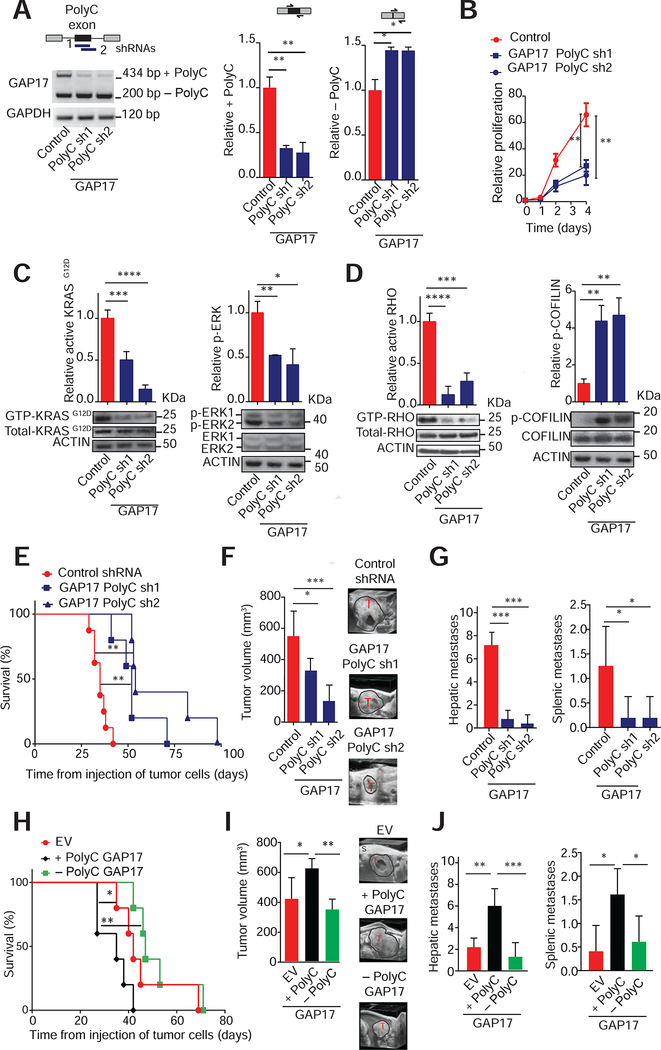
Figure 4: Targeting GAP17 isoforms decreases KRASG12D activation and increases survival in pancreatic cancer models.
A. Top left, schematic of isoform specific shRNAs targeting +polyC exon of GAP17 promoted by p53R172H. Bottom left, RT-PCR demonstrating isoform-specific knockdown of +polyC GAP17 in KPC cells using shRNAs against polyC exons (PolyC sh1 and sh2), compared to non-targeting control. Upper band: +polyC isoform; lower band: −polyC isoform. Right, qRT-PCRs for quantification of +polyC GAP17 or −polyC GAP17 isoform using primers that flank junctions between polyC exon and adjacent exons (exons 16 and 18) or primers that flank the junction between exons 16 and 18. Mean ± s.d, n = 3 replicates/condition. Student’s t-test.
B. Proliferation of KPC cells expressing control or +polyC GAP17 sh1 and sh2. Mean ± s.d, n = 3 repetitions/condition, Student’s t-test.
C. Affinity precipitation of GTP-bound active KRASG12D (left) or p-ERK (right) in KPC cells with knockdown of polyC GAP17 isoforms or control. Precipitation using GST-RAF1-RBD fusion protein, blotting using RASG12D antibody. Mean ± s.d, n = 3 replicates/condition. Student’s t-test.
D. Affinity precipitation of GTP-bound active RHO (left) and phosphorylated COFILIN (inactive form, bottom left) in KPC cells with knockdown of + polyC GAP17 isoform and control. Mean ± s.d, n = 3 replicates, Student’s t-test.
E. Kaplan-Meier survival (log-rank Mantel-Cox test) following orthotopic syngeneic transplantation of KPC cells expressing control or shRNAs against +polyC GAP17. n = 5–6 animals/condition.
F. Tumor volume by 3D-ultrasound 30 days post-orthotopic injection of cells expressing control or +polyC GAP17 sh1 or 2. Ultrasound images of tumors (T). S: Skin. Mean ± s.d, n = 5–6 animals/condition, Student’s t-test.
G. Number of hepatic and splenic metastases per animal bearing PDACs with expression of control or +polyC GAP17 sh1 and 2. Mean ± s.d, n = 5 animals/condition, Student’s t-test.
H. Kaplan-Meier survival (log-rank Mantel-Cox test) following orthotopic syngeneic transplantation of KPC cells with overexpression of +polyC or −polyC GAP17 isoforms or empty vector (EV). n = 5–6 animals/condition.
I. Tumor volume by 3D-ultrasound 30 days post-orthotopic injection of KPC cells expressing + polyC GAP17, −polyC GAP17, or EV. Representative ultrasound images of tumors (T). S: Skin. Mean ± s.d, n= 5 animals/condition, one-way ANOVA with Tukey multiple comparison.
J. Number of hepatic and splenic metastases per animal bearing PDACs with overexpression of +polyC or −polyC GAP17 or EV. Mean ± s.d, n = 3 repetitions/condition, Student’s t-test.
s.d, standard deviation; n, number of repetitions. *p < 0.05, **p < 0.01, ***p < 0.001, **** p < 0.0001. See also Figure S5.

