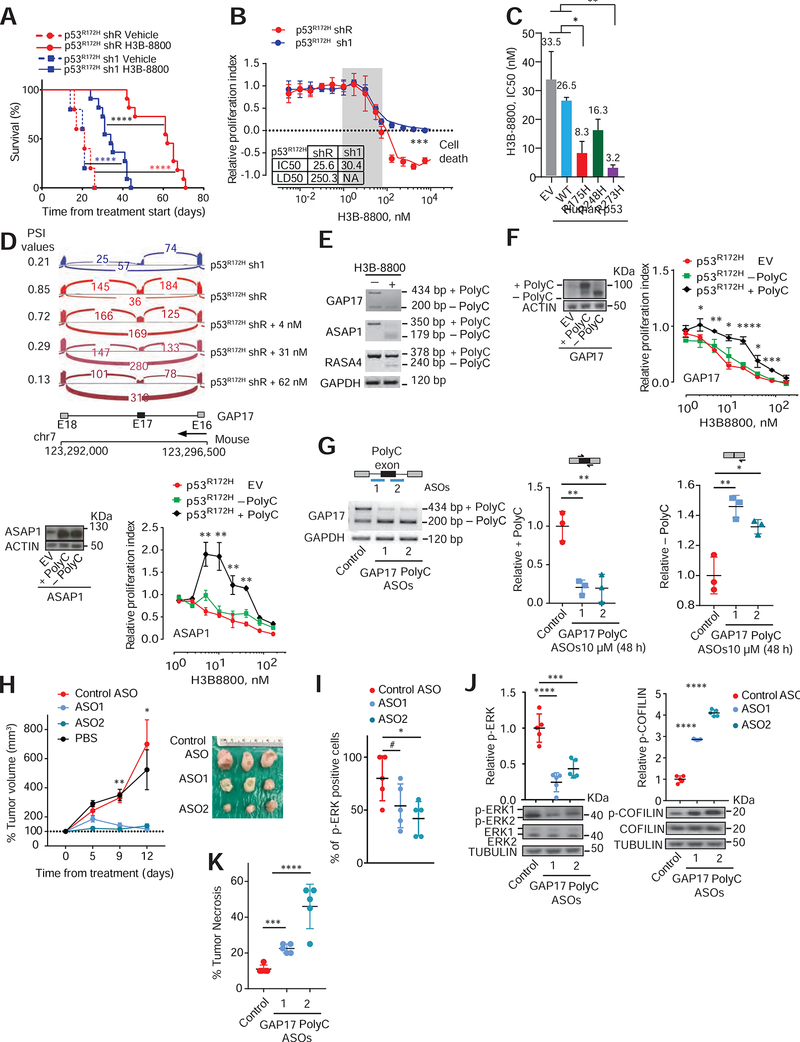
Figure 5: The spliceosome and polyC GAP isoforms are therapeutic vulnerabilities in p53R172H-pancreatic cancers.
A. Kaplan-Meier survival (log-rank Mantel–Cox test) following orthotopic syngeneic transplantation of KPC cells with either control renilla shRNA (shR) or shRNAs against p53 (sh1) and treated with either vehicle or H3B-8800 (at 8 mg/kg). Data are mean ± s.d, n = 5–11 injected animals/condition. For p53R172H shR vehicle versus H3B-8800, hazard ratio (HR) = 156, 95%CI= 17.16–1431; for p53R172H sh1 vehicle versus H3B-8800, HR= 76.5, 95%CI 9.47–617.9; for p53R172H sh1 versus shR (both with H3B-8800), HR= 17.25, 95%CI 4.92–60.4.
B. Dose-response curves in p53R172H expressing cells (shR) compared to sh1 cells treated with H3B-8800 for 48h. Relative proliferation index established by comparing cells treated with DMSO. Inset indicates inhibitor concentration that reduced proliferation by half (IC50) and that killed half of the cells (LD50). NA-Not applicable. Data represent mean ± s.d; n = 3 repetitions/condition, Student’s t-test. RNA-seq performed across a range of non-cytotoxic concentrations (grey box) to compare differences in exon splicing in cells with or without p53R172H.
C. IC50s to H3B-8800 in p53-null PDAC cells (KPFLC cells) overexpressing human wild-type p53 (WT), missense hotspot mutants R175H; R248Q; R273H, or empty vector (EV). Treatment for 48 h was done 30 days after confirmed overexpression. Data represent mean ± s.d; n = 3 repetitions/condition, Student’s t-test.
D. Sashimi plots illustrating C-rich exon (exon 17; E17) in GAP17 in murine PDAC cells without (sh1) or with mutant p53R172H (shR), untreated with H3B-8800 (top two sashimi plots). Bottom three sashimi plots refer to cells with mutant p53R172H (shR) treated with three non-cytotoxic H3B-8800 concentrations. PSI value is provided for each condition.
E. RT-PCR of loss of polyC exons in representative GAPs (Asap1, Rasa4 and Gap4) in KPC cells expressing p53R172H treated with non-cytotoxic H3B-8800 concentrations or vehicle, using primers that flank polyC exons. Upper bands in RT-PCRs denote the +polyC isoform, while lower bands correspond −polyC exon to isoforms.
F. Left, westerns of cDNAs encoding polyC and no polyC isoforms of GAPs (GAP17 and Asap1) or EV in KPC cells. Molecular weight difference between +polyC and −polyC ASAP1 isoforms is not large enough to distinguish by western. Right, dose-response curves in p53R172H-expressing cells overexpressing polyC and non-polyC isoforms of GAPs GAP17 and ASAP1, or EV treated with H3B-8800 for 48 h. Mean ± s.d; n = 3–5 repetitions/condition, Student’s t-test.
G. Schematic of antisense oligonucleotides (ASOs) (top left) and corresponding RT-PCRs (bottom left) and qRT-PCRs (right) for quantification of +polyC GAP17 or −polyC GAP17 isoforms in KPC cells 48 h after treatment with 10 μM ASOs. Mean ± s.d, n = 3 repetitions, Student’s t-test.
H. Left, tumor volume after in vivo ASO treatment of KPC sub-cutaneous xenografts. Tumor volume measured twice/week during treatment with non-targeting ASO control (NC) or +polyC GAP17-targeting ASOs. ASOs given at 12.5 mg/kg, every other day intratumorally. Right, representative PDAC images. Mean ± s.d, One-way ANOVA, with Tukey multiple comparison.
I. Immunohistochemistry quantification for p-ERK1/2 in PDACs treated with non-targeting ASO control or +polyC GAP17-targeting ASOs. Mean ± s.d, n = 5 PDACs, One-way ANOVA, with Tukey multiple comparison.
J. Relative p-ERK1/2 (left) and p-COFILIN (right) in non-targeting ASO control (NC) or +polyC GAP17 targeting ASOs (ASO1 and 2). Lysates generated from viable tumor areas. Data represent mean ± s.d, n = 5 PDAC, One-way ANOVA, with Tukey multiple comparison.
K. Percentage necrotic tumor area following in vivo ASO treatment of KPC allografts. Data represent mean ± s.d, n = 3–5 PDACs, One-way ANOVA, with Tukey multiple comparison.
s.d, standard deviation; n, number of repetitions; # p< 0.1*p < 0.05, **p < 0.01, ***p < 0.001, ****p< 0.0001. See also Figure S5.

