
Figure 4.
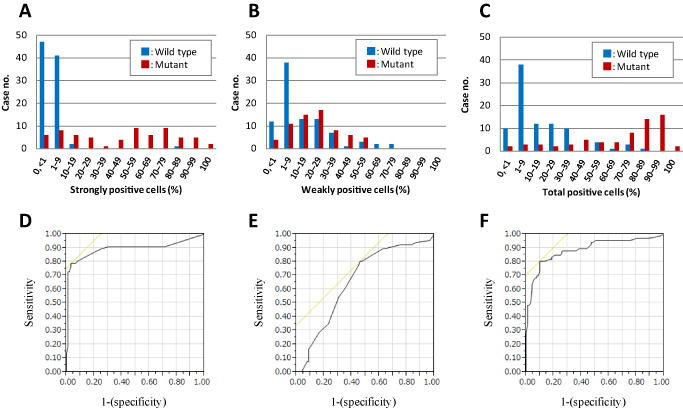
Histograms of cases with positive immunohistochemistry are shown according to the mutation status (blue, wild type; red, mutant). The histograms are for strongly positive (A), weakly positive (B) and positive cells with any intensity (total positive cells; C). Using these counts, a receiver operating characteristic (ROC) analysis was performed (D–F). The ROC curves showed that 14%, 7% or 40% positive cell counts were the appropriate cutoff values in each category, with the areas under curves showing 0.894, 0.664 and 0.887, respectively.