
Figure 3.
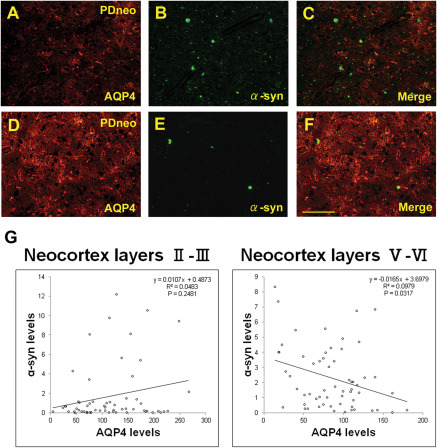
Double immunofluorescence for AQP4 (A, D) and α‐synuclein (α‐syn, B, E) in the PDneo group. Merged image of both signals (C, F). An area with intense AQP4 IR shows sparse α‐syn IR (D–F), whereas another area with relatively weak AQP4 IR contains Lewy bodies and several α‐syn IR (A–C). Scale bar: 100 μm. G: plot of α‐syn and AQP4 IR levels (RFU: relative fluorescence units) in the PDneo group. Semiquantitative analysis revealed a significant negative correlation between α‐syn and AQP4 in cortical layers V–VI (R2 = 0.0979, P = 0.0317), but not in layers II–III.