
Figure 4.
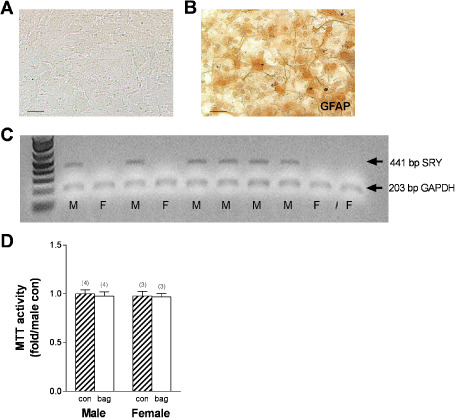
Sex‐specific mature astrocytic primary cultures. A. Representative phase contrast image of cell growth after approximately 21 days in cultures, scale bar = 5 μm. B. Representative GFAP labeling of primary cultures showing nearly universal GFAP expression, scale bar = 5 μm. C. Agarose gel showing SRY positive and negative cultures following amplification. D. Astrocyte viability was assessed using MTT assays after incubation in a standard freezer bag (numbers in parentheses indicate the n for each group). Striped bars indicate control astrocyte cultures. Solid white bars indicate bag‐incubated astrocyte cultures.