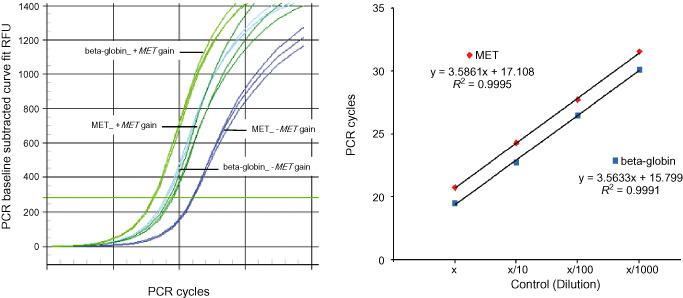
Figure 1.

Quantitative PCR showing MET gain in low‐grade diffuse gliomas. The left‐hand figure shows the original quantitative PCR graph for low‐grade diffuse gliomas with (+MET gain) and without (−MET gain) MET gain. Relative CT values for MET and beta‐globin at different concentrations of normal control DNA are shown. The slopes of the curves are similar, suggesting equal efficiencies of the two PCR reactions (right).
