
Figure 1.
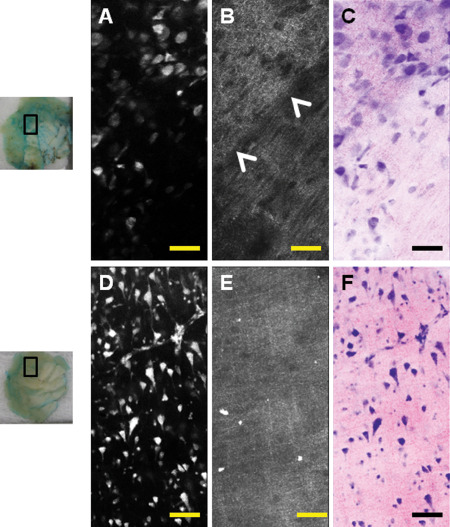
Examples of normal brain visualized by dye‐enhanced multimodal confocal microscopy. Images are taken from pieces of normal brain tissue (left column, insets represent where images were taken). Shapes of neurons as well as cortical architecture can be readily observed by fluorescence (A,D). Corresponding reflectance images (B,E) show a well‐defined margin between gray and white matter (B, arrowheads). Gray matter has a finely granular appearance on reflectance (B, top and E) while white matter is denser (B, bottom). Virtual haematoxylin and eosin (H&E) image can be created from information obtained by fluorescence and reflectance. Images can be pseudocolored to resemble H&E. (C,F) Scale bar represents 100 μm.