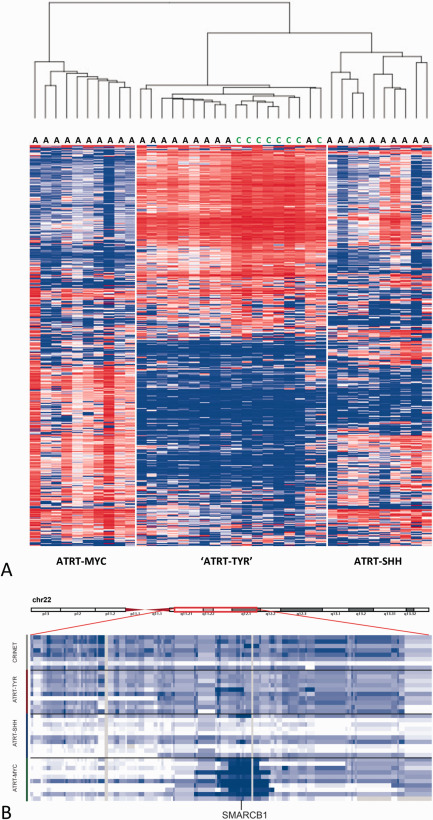
Figure 2.

Molecular profiling of CRINET vs. ATRT. Heatmap showing unsupervised clustering of methylation profiles of 38 samples using the 5000 most variable probes (A) as well as copy number alterations affecting chromosome 22q (B) of 8 CRINETs and ATRTs of the molecular subgroups TYR, SHH and MYC (n = 10 each). Note that all CRINETs cluster within the ATRT‐TYR subgroup and (like ATRT‐TYR) show large heterozygous deletions of 22q affecting the SMARCB1 locus.
