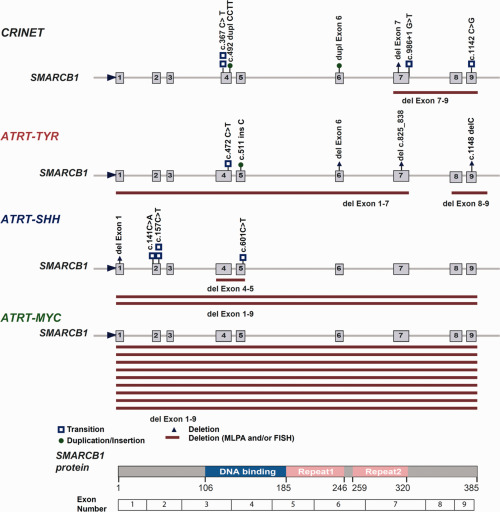
Figure 3.

Spectrum of SMARCB1 mutations in CRINET vs. ATRT. SMARCB1 mutations encountered on FISH, MLPA and sequencing in CRINETs as compared to ATRTs of the molecular subgroups TYR, SHH and MYC (n = 10 each). Note similar distribution of mutations across the SMARCB1 gene in CRINET and ATRT‐TYR. Plotted are only hits affecting the second SMARCB1 allele. For more details, see Table 1 and Supporting Information Table S1.
