
Figure 7.
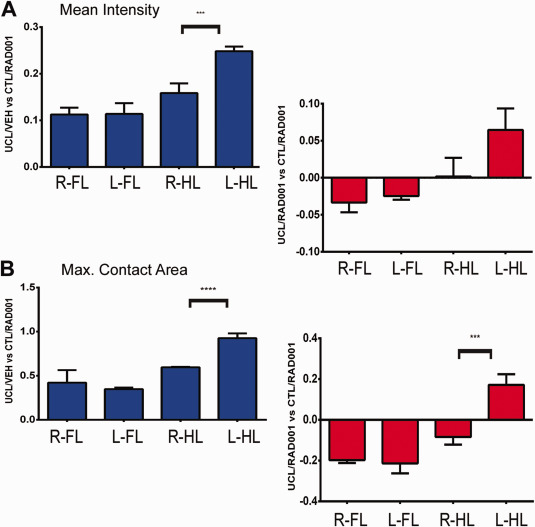
Catwalk automated gait analysis of young rats exposed to UCL/HI at P6. Experimental groups were prepared and submitted to catwalk gait analysis as described in Materials and Methods. Depicted are mean ratios (±SEM) of pawprints mean contact intensity (A) and maximum contact area (B) for right (R) and left (L) forelimbs (FL) and hindlimbs (HL) of P35–37 rats exposed to UCL/HI at P6, normalized against age and sex matched normoxic controls (treated with everolimus, CTL/RAD; n = 10). Right side/left side gait analysis is shown for UCL/HI rats treated with vehicle (UCL/VEH; n = 13) or everolimus (UCL/RAD; n = 15). *P < 0.05 right vs. left side.