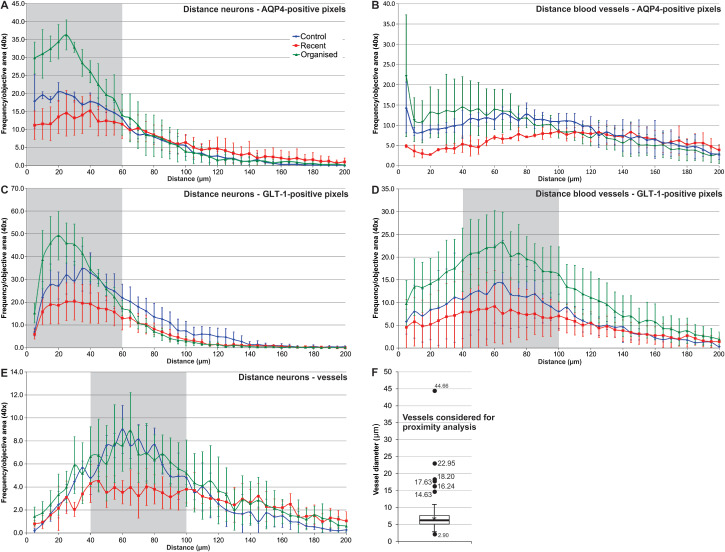
Figure 3.

Aquaporin 4 ( AQP 4)/glutamate transporter 1 ( GLT ‐1) distance frequency distribution in relationship with neurons and blood vessels. AQP4‐positive pixels aggregated around neuronal membranes (stained for nicotinic acetylcholine receptor, AchR), with a peak at around 20–40 μm distance from the AchR signals, for all instances studied (A); organized perilesional cortical areas had a denser AQP4 distribution, especially in the 0–60 μm perineuronal interval compared with recent perilesional and control cortices. AQP4‐positive pixels were grouped close around blood vessels' basement membranes (<10 μm), and if considering only the data for the first 100 μm around the blood vessels, the perilesional recent cortices showed significant lower AQP4 pixel frequencies compared with the other two categories (B). GLT‐1‐positive pixels also aggregated around AchR signals, mostly at around 20–40 μm, but with lower density in the immediate neuronal vicinity, compared with AQP4 (C). GLT‐1 distribution around blood vessels showed a peak for all studied instances at 40–100 μm around the vessels, organized lesions having higher densities compared with recent and organized lesions; compared with AQP4, there was no frequency peak in the immediate perivascular compartment (D). AchR‐positive pixels' aggregation around vessels (collagen IV) revealed a peak at a distance of 40–100 μm, with no difference between organized lesions and controls; recent lesions showing a lower plateau in this interval, probably because of edema (E). Also, the amplitude of the AchR collagen IV mapping was decreased compared with the other four instances studied. The diameters of the vessels included in these proximity studies ranged between 2.90 and 44.66 μm, with an average of 6.85 μm (*), a median of 6.17 μm (horizontal bar), a standard deviation of 3.71 μm (error bars) and a Q1–Q3 interquartile interval of 2.34 μm (box plot) (F). Points indicate the average values; error bars represent standard deviation (A–E). Gray‐shaded areas represent intervals for which frequency distributions could statistically differentiate between all three pathological instances considered (one‐way analysis of variance with Tukey's post hoc comparisons); error bars represent standard deviation (A–E).
