Figure 3.

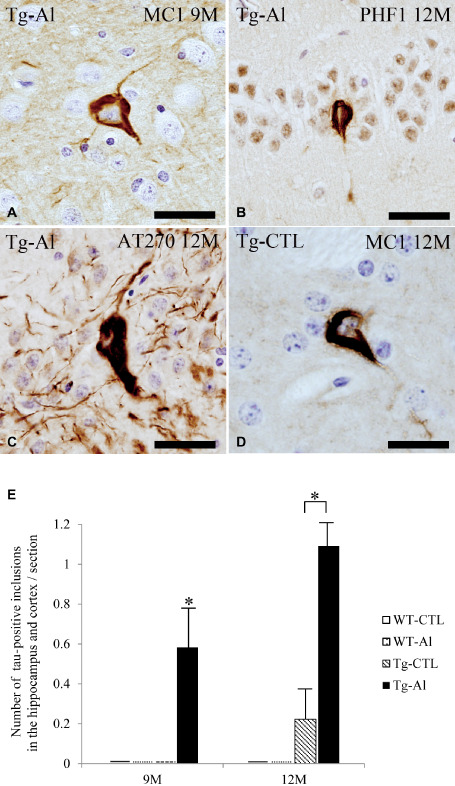
Cytoplasmic tau accumulation in cortex and hippocampus in representative tau Tg mice with and without Al treatment. A–C. NFT‐like tau‐positive inclusions in the hippocampus in Al‐treated 9‐ (A) and 12‐month‐old tau Tg mice (B,C). D. NFT‐like cytoplasmic tau accumulation in the hippocampus in the brain in a 12‐month‐old tau Tg mouse without Al treatment. (A,D) MC‐1 immunohistochemistry, (B) PHF1 immunohistochemistry, and (C) AT270 immunohistochemistry. All scale bars = 30 μm. E. The numbers of tau‐positive cytoplasmic inclusions in the cortex and hippocampus in tau Tg mice with (Tg‐Al) and without (Tg‐CTL) Al treatment at 9 and 12 months. The mean numbers of inclusions in the cortex and hippocampus in Tg‐Al mice were significantly larger than those in Tg‐CTL mice at 9 and 12 months, respectively (Student's t‐test, P = 0.012 and 0.048). The data of WT at all experimental time points and Tg mice at 3 and 6 months are not shown because no mouse had tau‐positive inclusions at that age. A significant difference between experimental groups is indicated by asterisks (*P < 0.05). The error bars represent SEM.
