
Figure 3.
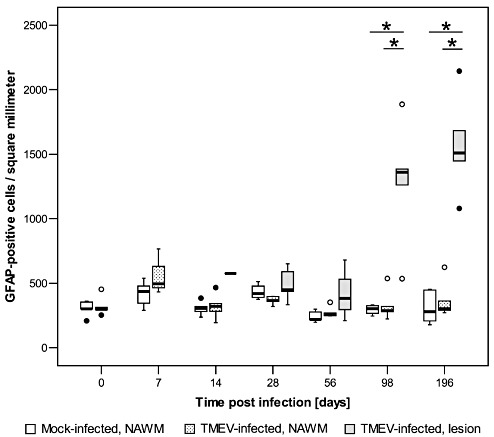
Density of astrocytes in the thoracic spinal cord of mice after Theiler's murine encephalomyelitis virus (TMEV) infection and mock infection, shown as glial fibrillary acidic protein (GFAP)‐positive cells per square millimeter of normal appearing white matter (NAWM; mock‐ and TMEV‐infected mice) and demyelinated white matter areas (lesion; TMEV‐infected mice). Box and whisker plots show median and quartiles with outliers and extreme values depicted as circles and filled circles, respectively. Following TMEV infection, the density of intralesional GFAP‐positive cells (astrocytes) was significantly increased at 98 dpi and 196 dpi compared with NAWM of TMEV‐ and mock‐infected mice. Significant differences between mock‐ and TMEV‐infected mice as revealed by a Mann–Whitney U test, and between NAWM and lesion in TMEV‐infected mice as detected by a Wilcoxon test are marked as follows: *P < 0.05.