
Figure 2.
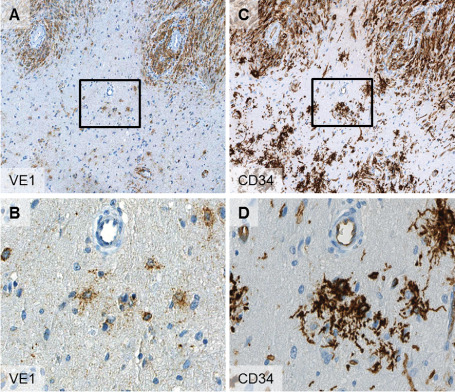
Serial sections of border zone of PXA (id 60358) with solid tumor areas (A,C upper areas) and infiltration zone (A,C lower areas). Note the high congruence of VE1 and CD34 expression in the solid tumor areas as well as in adjacent “satellite” cells in the infiltration zone (B,D). The boxes in (A) and (B) indicate the field of higher magnification seen in (B) and (D). Magnification: 100× (A,C); 400× (B,D).