
Figure 6.
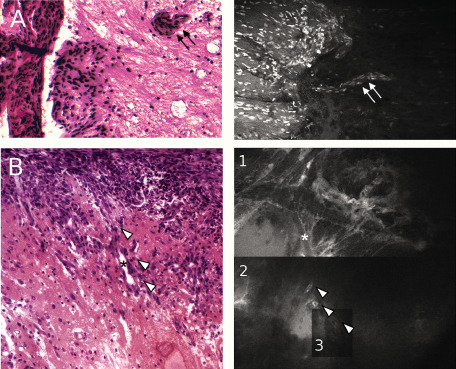
Confocal imaging of brain invasion. A. Hematoxylin eosin safran (HES) slide (left panel) demonstrating invasion of meningothelial cells from the meningioma inside the brain parenchyma along blood vessels (double black arrow). Confocal image (right panel) reliably reproduces the image of Virchow–Robin spaces invasion (double white arrow). B. HES slide (left panel) illustrates the pattern of brain invasion found in the orthotopic syngeneic model (OSM) model. Confocal image (right panel) is divided in three parts (noted 1, 2 and 3) corresponding of three different levels of depth at the same location. The vessel lumen (asterisk) going inside the brain can be clearly identified while scattered tumor cells (white arrowheads) are found at each level of depth.