
Figure 2.
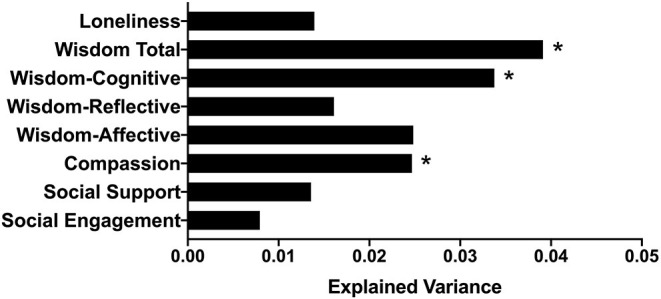
Bar plot indicating the proportion of variance in beta-diversity (Aitchison distance) explained by each psychosocial factor, after controlling for age and BMI. *p or q < 0.05.
Official websites use .gov
A
.gov website belongs to an official
government organization in the United States.
Secure .gov websites use HTTPS
A lock (
) or https:// means you've safely
connected to the .gov website. Share sensitive
information only on official, secure websites.
Bar plot indicating the proportion of variance in beta-diversity (Aitchison distance) explained by each psychosocial factor, after controlling for age and BMI. *p or q < 0.05.