
Figure 5.
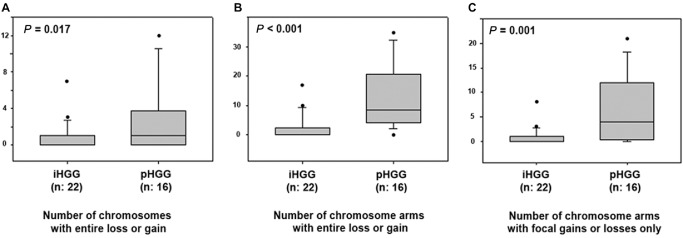
Box plot diagrams of the comparison of infants vs. non‐infant high‐grade gliomas (HGGs) using a Mann–Whitney rank sum test. The graphs show the number of chromosomes with cytogenetic alterations (gain/losses) affecting the whole chromosomes (A), the number of chromosome arms with cytogenetic alterations (gains/losses) affecting the entire chromosome arm (B) and number of chromosome arms with focal copy number aberrations (C) in infant high‐grade gliomas (iHGGs) compared to pediatric high‐grade gliomas (pHGGs). The iHGGs presented a significantly lower frequency of chromosomal alterations when compared to their non‐infant counterparts. The horizontal line represents the median value; the lower and upper limits of the box represent the interquartile range. Focal copy number aberrations are defined as gains or losses spanning from 10% to 50% of a chromosome arm.