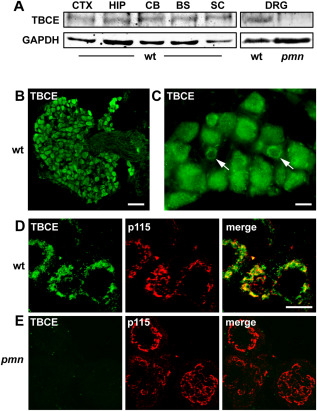
Figure 2.

TBCE expression in DRG neurons of wildtype and pmn mice. A. Immunoblot showing expression of TBCE (∼59 kD) at similar level in cortex, hippocampus, cerebellum, brainstem, spinal cord and DRGs of 35‐day‐old wt mice. Note loss of TBCE expression in DRGs of pmn mice as compared to wt. Loading control: GAPDH. B. Immunofluorescence labeling of a lumbar DRG from a wt mouse shows strong TBCE expression in neuronal cell bodies but not in axons. Scale: 50 µm. C. Immunofluorescence labeling shows cytosolic and perinuclear (arrows) distribution of TBCE. Scale: 10 µm. D, E. Confocal imaging showing TBCE protein expression at the p115‐labeled Golgi membrane in wt DRG neurons (D) and the loss of TBCE from the Golgi membrane in pmn DRG neurons (E). Scale: 10 µm.
