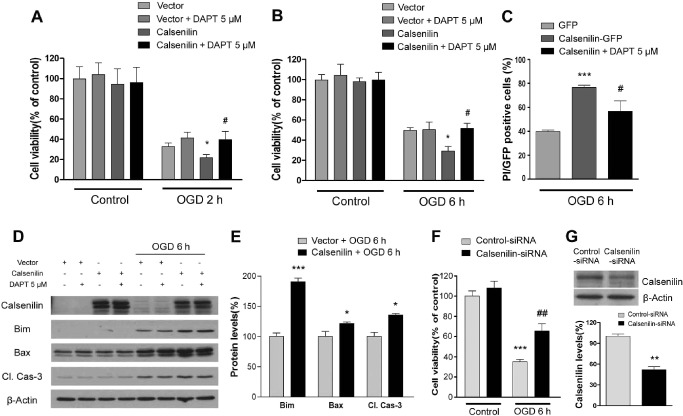
Figure 4.

Calsenilin regulated oxygen glucose deprivation (OGD)‐induced neuronal cell death and the levels of associated signaling proteins. A. Primary cortical neurons were transfected with either vector or calsenilin constructs. Transfected primary cortical neurons pretreated with 5 μM DAPT for 12 h. Primary cortical neurons were exposed to 2 h of OGD. The overexpression of calsenilin increased OGD‐induced cell death as determined by luminescent cell viability assay. Values are the mean with standard error of measurement (SEM). (n = 3). *P < 0.05 vs. vector + OGD 2 h, # P < 0.05 vs. calsenilin + OGD 2 h. B. Overexpressed HT‐22 cells were exposed to 6 h of OGD. The overexpression of calsenilin significantly increased cell death caused by OGD, but the γ‐secretase inhibitor DAPT reduced this cell death. Values are the mean with SEM. (n = 3). *P < 0.05 vs. vector + OGD 6 h, # P < 0.05 vs. calsenilin + OGD 6 h. C. Only green fluorescence protein (GFP)‐positive dead cells were counted and cell death measured by propidium iodide (PI) staining. Values are the mean with SEM. (n = 4). ***P < 0.001 vs. GFP, # P < 0.05 calsenilin‐GFP. D. Immunoblot showing the levels of proteins involved in OGD‐induced neuronal death. The top panel confirms calsenilin overexpression. The pro‐apoptotic proteins Bim, Bax, and cleaved caspase‐3, whose levels were increased by OGD, were further increased by calsenilin overexpression. Whereas, these changes were independent of γ‐secretase inhibition by DAPT. E. Quantification of D normalized to β‐actin levels as a loading control. Values are the mean with SEM. *P < 0.05, ***P < 0.001 vs. calsenilin + OGD6 h. F. Silencing of calsenilin enhanced cell viability in OGD‐induced HT‐22 cells as detected by luminescent cell viability assay. Values the mean with SEM. (n = 3). ***P < 0.001 vs. control‐siRNA + control. ## P < 0.01 vs. control‐siRNA + OGD 6 h. G. Down‐regulation of calsenilin protein was confirmed by performing ummunoblot analyses. For quantification calsenilin levels were normalized to β‐actin levels as a loading control. Values are the mean with SEM. **P < 0.01 vs. control‐siRNA.
