Figure 2.

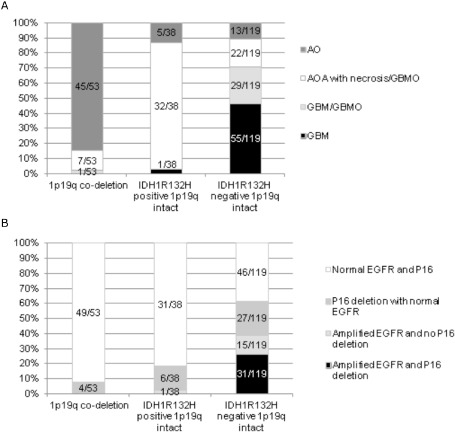
A. Histological diagnosis distribution according to the three molecular subgroups defined regarding 1p/19q co‐deletion and IDH1 R132H expression status. B. EGFR amplification and p16 deletion status in these three molecular subgroups.

A. Histological diagnosis distribution according to the three molecular subgroups defined regarding 1p/19q co‐deletion and IDH1 R132H expression status. B. EGFR amplification and p16 deletion status in these three molecular subgroups.