
Figure 4.
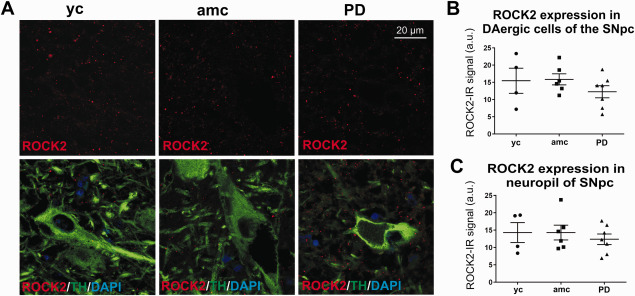
Analysis of ROCK2 expression in the SNpc of PD cases and controls. Representative micrographs of ROCK2‐IR (A, upper panel) and double immunoreactive ROCK2/TH‐co‐stainings (A, lower panel). ROCK2‐IR was evaluated in TH‐IR cells (B, yc: n = 4; amc: n = 6; PD: n = 7; n.s.) and in the adjacent neuropil (C, yc: n = 4; amc: n = 6; PD: n = 7; n.s.). Data is given in averaged values from each case; bars represent means per group ± SEM (One‐way‐ANOVA).