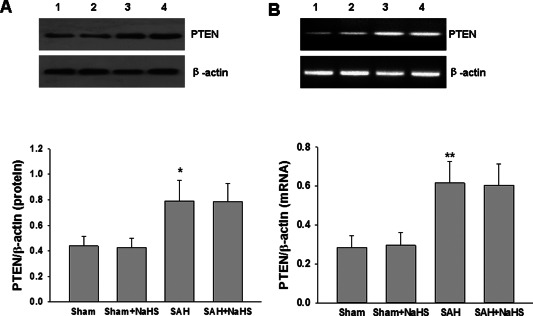
Figure 8.

Effect of NaHS on PTEN expression. (A) The levels of PTEN in the PFC at 48 h after SAH were measured by western blotting, and β‐actin was used to evaluate protein loading. Bar graphs showing quantification of the protein levels of PTEN were determined by Image‐Pro Plus 6·0; n = 3. (B) The relative expression levels of PTEN mRNA in the PFC were analyzed by semiquantitative RT‐PCR. Each value was normalized to β‐actin. Bar graphs showing quantification of mRNA levels of PTEN was determined by Image‐Pro Plus 6·0, n = 3. Values represent the mean ± SD, *p < 0.05, **p < 0.01 SAH VS Sham. 1 Sham, 2 Sham + NaHS, 3 SAH, 4 SAH + NaHS.
