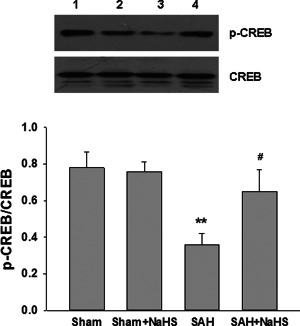
Figure 10.

Effect of NaHS on CREB phosphorylation. (A) At 48 h after SAH, entire PFC extracts were subjected to western blot analysis using an antibody against phospho‐CREB (p‐CREB) and CREB. Bar graphs showing quantification of expression levels of p‐CREB/CREB were determined by the Image‐Pro Plus 6.0. Values represent the mean ± SD; n = 3. **p < 0.01 SAH vs. Sham; #p < 0.05 SAH + NaHS vs. SAH. 1 Sham, 2 Sham + NaHS, 3 SAH, 4 SAH + NaHS.
