
Figure 12.
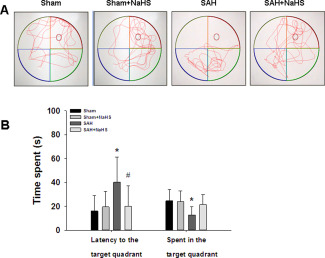
Effects of NaHS administration during probe trial in the Morris water maze test. (A) Display of tracks of all groups on the sixth day, when the training platform (small blue circles) was removed and activity was monitored for 60 s. (B) The escape latency and percent time spent in the target quadrant in the spatial exploratory test was recorded and analyzed. Values represent the mean ± SD, n = 10, *p < 0.05, SAH vs. Sham; #p < 0.05 SAH + NaHS vs. SAH.