
Figure 2.
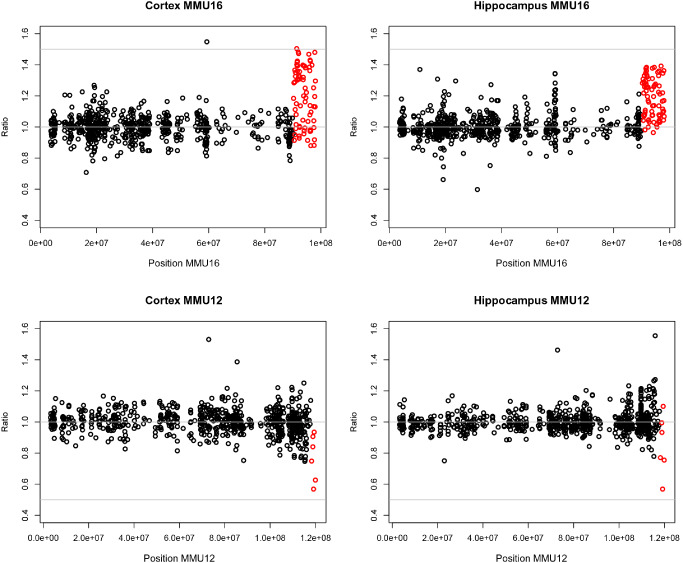
Chromosome plot of MMU16 and MMU12 gene expression in Ts1Cje cortex and hippocampus. Aneuploid genes are indicated in red. Results from the cerebral cortex and the hippocampus are represented on the left and the right, respectively. Sod1 and Dnahc11 were excluded because their expression levels did not follow the gene‐dosage effect as a result of the translocation (abnormal loci). MMU16 and MMU12 genes positions were mapped on the mouse genome (using NCBI mouse genome map, build 38.1).