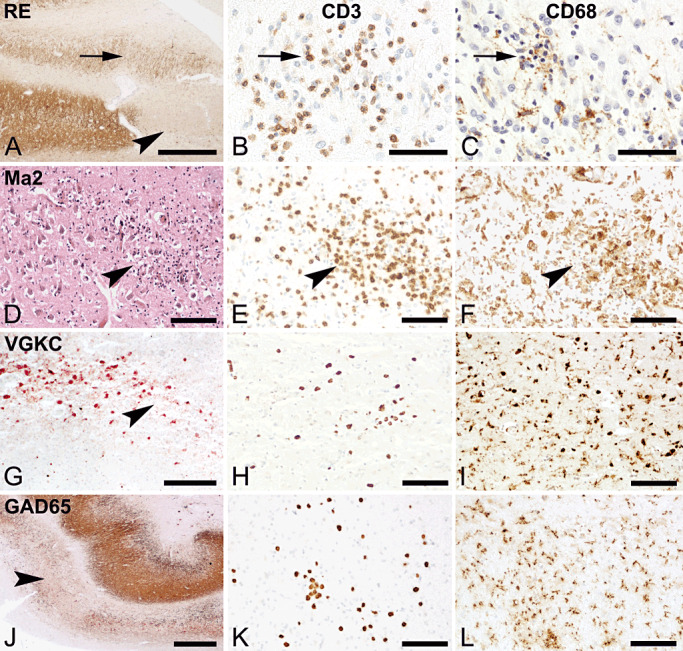
Figure 1.

Pathology in the hippocampus of various forms of encephalitis. Left column shows neurodegeneration (HE or MAP‐2 staining), middle column shows T‐cell infiltration by staining for CD3. Right column shows microglia activation and/or macrophage infiltration by staining for CD68. (A, bar 500 µm) Hippocampus of RE patient shows complete neuronal loss in the CA3 region (arrowhead). The arrow shows at the area in the dentate gyrus, which contains inflammatory cells as shown in (B, bar: 50 µm) and activated microglial cells (C, bar: 50 µm). D, E and F. Hippocampus of a paraneoplastic MA2 case. (D, bar: 100 µm) HE staining shows loss of cells (arrowhead) and inflammatory cells. Staining for CD3 (E, bar:100 µm) and CD68 (F: bar:100 µm) show infiltration of T‐cells and activated phagocytic microglial cells. G, H, I. Hippocampus of a nonparaneoplastic anti‐VGKC complex case. (G, bar 200 µm) Loss of neurons in CA2 indicated by the arrowhead, staining for MAP‐2. The staining for CD3 shows low numbers of infiltrating T‐cells (H, bar:100 µm) while CD68 shows strongly activated microglial cells (I, bar:100 µm). J, K and L. Nonparaneoplastic anti‐GAD65 case. (J, bar:200 µm) Staining for MAP‐2 shows severe loss in the CA2 region. The area harbors moderate numbers of CD3+ T‐cells (K, bar:100 µm) and activated microglial cells (L, bar:100 µm).
