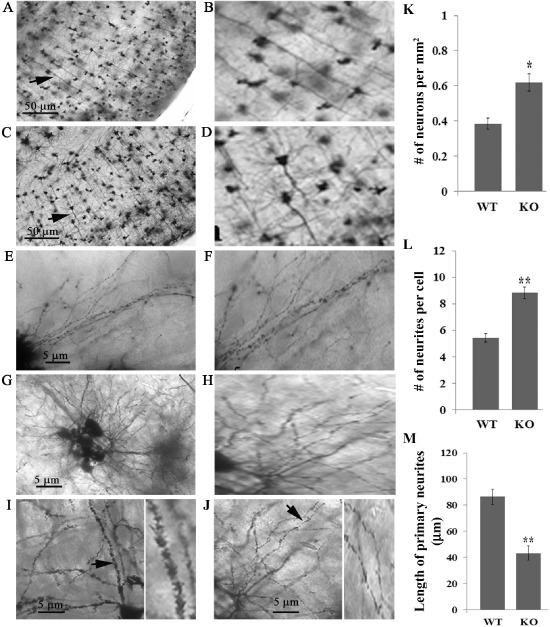
Figure 4.

Lgi1 mutant null mice exhibit abnormalities in axon structure. Representative image of Golgi‐Cox staining from normal (A) and mutant null (C) mice at P11 shows misalignment of axons in the mutant mice compared with the normal mice (arrows). Right panels (B and D) show the arrowed neurons from A and C at higher magnification. The dendritic tree complexity is also increased in mutant mice (G) compared with normal mice (E). Right panels (F and H) show a higher magnification segment of the axon from the mutant neurons (G) compared with control neurons (E). When dentrite morphology is compared, the normal mice (I) show long well‐directed dendrites with smooth contours and pointed ends (arrow). A higher magnification image is shown to the right. In the mutant mice (J), shorter and irregular dendrites are seen with fuzzy contours and round‐headed ends (arrow). A higher magnification is shown to the right. Quantitation of the images shows increased neurons in the outer cortical layers of the mutant mice (K) as well as increased number of neurites (L) and decreased neurite length (M).
