
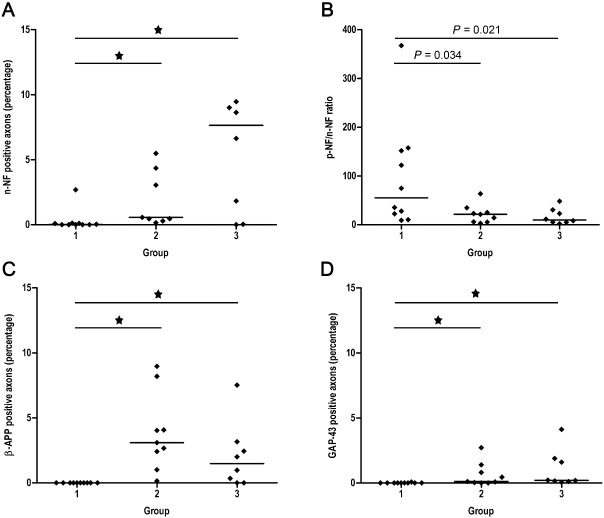
Figure 4.
Scatter plots with median illustrating the results of the quantitative immunohistochemical analysis of axonal changes in the lesion epicenter of canine SCI. Group 1 = controls, group 2 = dogs with acute SCI, group 3 = dogs with subacute SCI. Statistically significant differences are marked with an asterisk (Kruskal–Wallis test with subsequent pairwise Mann–Whitney U ‐test, alpha adjusted according to the method of Bonferroni). (A) The percentage of axons expressing n‐NF is increased in dogs with acute and subacute SCI compared with controls. (B) Depiction of the p‐NF/n‐NF ratio as determined by morphometrical assessment of the immunopositive total white matter. Because of the relative increase in n‐NF expression there is a decrease of the p‐NF/n‐NF ratio in dogs with acute and subacute SCI compared with controls. (C) The percentage of axons expressing β‐amyloid precursor protein is increased in dogs with SCI compared with controls. (D) Similarly, the percentage of axons expressing growth‐associated protein‐43 is increased in traumatized dogs compared with healthy controls. n‐NF = non‐phosphorylated neurofilament; p‐NF = phosphorylated neurofilament; SCI = spinal cord injury.